Capacitive sensing has become an important capability for implementing advanced user interfaces in almost all the areas of electronics, including consumer and automotive applications. Efficient and smooth capacitive performance depends on how the design is tested and analyzed, especially when capacitive sensing is used to perform proximity sensing. For many OEMs, testing proximity sensing is a major challenge, given that performance is bounded by the viable distance recommended for proximity detection. This article discusses the design of a capacitive sensing-based proximity sensitivity analyzer that can be used to not only find out the distance of sensitivity, but also to calculate the raw count of the sensor, calculate the threshold values for detection, and give the estimated axis position of sensing. This application can be used by any test engineer to validate capacitive sensing-based proximity sensing in an efficient manner.
In general, a proximity analyzer is a useful tool for the research, design, and testing of capacitive sensing-based applications. With a proximity analyzer, engineers can tune both proximity range and more generic capacitive sensing features like noise baseline, threshold for sensor detection, IDAC counts etc. While capacitive tuning can be done using software, this approach doesn’t provide an intuitive feel during the process. It also involves multiple iterations. Instead, the device under test (DUT) can be tested automatically using feedback mechanisms that do not require engineers to spend time tuning the design.
Figure 1 shows the block diagram of a capacitive sensing-based system. The system has a main controller, in this case a PSoC 4AM, part of the Cypress PSoC 4000S series.
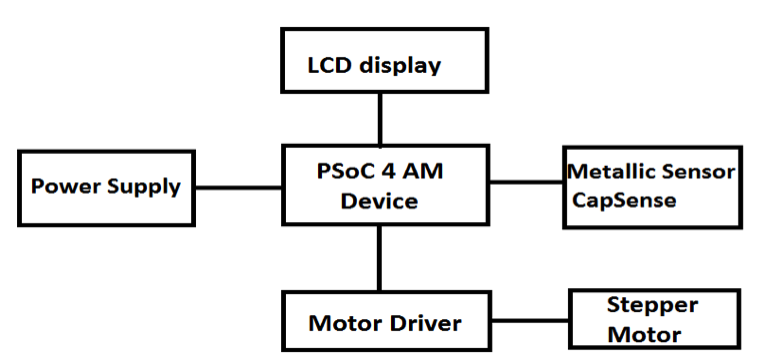
Figure 1: Block diagram of a capacitive sensing-based system. Credit: Cypress
First, the microcontroller is used to determine the distance between the ground level (i.e., the DUT itself) and the metallic sensor plate used to sense proximity. The generated raw data is then analyzed and the system self-generates feedback to adjust the stepper motor for its relative degree of movement either clockwise or anticlockwise, depending upon the sensitivity of the data received.
Figure 2 shows the system diagram of this arrangement. Note that the circuitry is located towards the base of the system so that it is easily accessible. The display is connected to the center of the system for ease of viewing. The DUT, in this case a board containing a proximity sensor, should be placed at a fixed height. This will eliminate inaccuracies during testing due to variations in the surface height. To prevent this, the system should have a reference surface of fixed height above which DUT should be placed. This height can then be subtracted from the total height to get the actual proximity distance. The net distance is therefore calculated from the base of the height of the surface added to the system.
The sensor is connected to the motor, which is movable on the vertical axis of the system. A stepper motor is recommended for accurate movement of the motor; however, a servo could be used for fine movement.
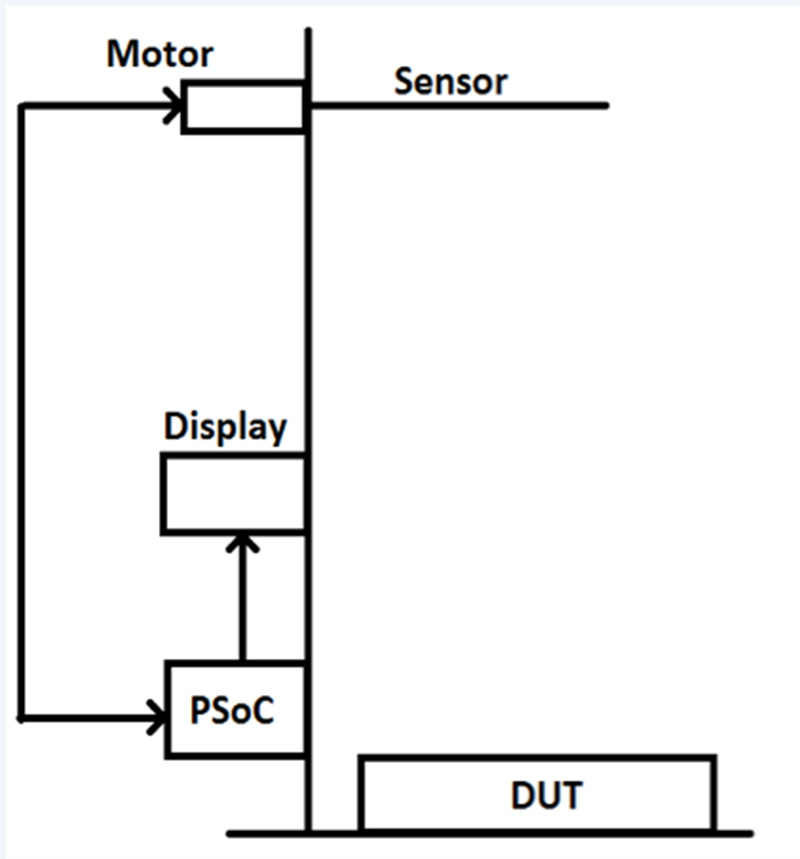
Figure 2: System block diagram of proximity analyzer setup. Image: Cypress
Figure 3 shows how the mechanical system is integrated. The log display system moves along with the motor to give a better user experience. A metallic base is used for stability.

Figure 3: The mechanical system design of the proximity analyzer.
Figure 4 shows the initial version of the mechanical system design of the proximity sensor. The design can utilize a readily available development kit, such as the Cypress CY8CKIT-044, to accelerate development and simplify mechanical integration. Using this system, developers can estimate the range of proximity of the device and auto-tune it to determine the tuning parameters to be used with the sensor.
To begin testing, developers set the expected distance for proximity. The MCU then outputs the relative motor position based on the sensitivity and raw counts it calculates from the sensor. Based on the minimum height, the MCU then calculates the appropriate sensor parameters by feeding the updated sensor tuning data to the DUT. Through continuous regression, the MCU auto-calibrates the system to have the best possible proximity sensitivity.
Algorithm
The auto-tuning algorithm involves continuous feedback monitoring and adjustment to the motor through data sent over the GPIOs. Figure 5 shows the flow of the auto-tuning algorithm.
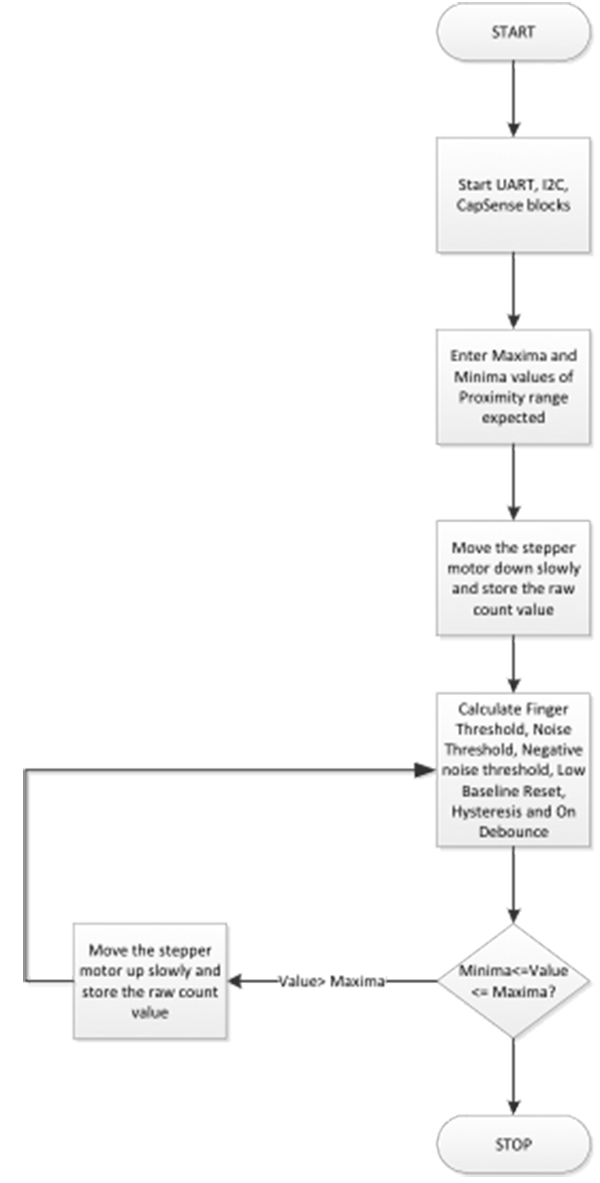
Figure 5. Steps to the auto-tuning algorithm.
The auto-tuning steps are as follows:
- Start the UART, I2C and CapSense Blocks
- Assign pins as strong drive as they are going to drive the stepper or servo motor
- Enter the required maximum and minimum proximity range for use in the final application to the MCU using the UART interface.
- Read the value entered by the user
- Move the motor downwards in steps (i.e. such as a step size of 2 mm).
- Keep monitoring the raw count value of the DUT using the GPIO which is connected to the capacitive sensing pin on the DUT.
- Stop when proximity is detected.
- If the DUT yields the same proximity range of maximum and minimum as expected, stop and display the tuning parameters (i.e., sense clock frequency, sensor threshold, noise threshold, base line, and proximity distance).
- If the proximity range does not match the proximity range given by the user, input the new sensor tuning parameters. These include finger threshold, noise threshold, negative noise threshold, low baseline reset, hysteresis, and on debounce. Note that these parameters are based on distance (i.e. when the distance is greater than or less than the maximum or minimum).
- Retune the system by operating the motor until the raw count is calculated as high or proximity is detected.
- If the proximity range is still not detected, go to step 6. Otherwise go to step 5.
As this is an iterative process, it can take some time to complete. With continuous access to the sensor threshold, sense clock frequency, noise threshold, negative noise threshold, baseline, and resolution, developers can choose the required parameters to help speed tuning.
To modify the analyzer to tune capacitive buttons and sliders, the algorithm can be changed to detect touch rather than proximity. To make this adjustment, the tuning parameters, the way the developer enters the maximum and minimum, and the touch mechanical system change to enable an artificial touch mechanism that can be used to tune the system accordingly.
As an enhancement to the system, the display on the system could also measure the parasitic capacitance of the sensor. This would help to identify better routing of the board during initial tests. This information is available through the Built-In Self Test (BIST) capabilities of the MCU and accessed through a development environment such as PSoC Creator. For more details on capabilities of BIST, refer to CapSense Design Guide.
This approach to a proximity analyzer works well in lab environments where designers require the system to auto tune as quickly as possible. It can also be used for manufacturing test to measure the performance of boards in volume before they are shipped to customers.
In this article, we have described how to auto calibrate as well as measure the sensitivity of a proximity sensor. This approach to a proximity analyzer, using the DUT itself, can also be modified to tune various other capacitive components like buttons and sliders. The flexibility of this approach and how it eases calibration can save extensive time compared to manual sensor tuning. In addition, this automated approach not only tunes systems but can also verify the overall capabilities of the system.
Filed Under: TEST & MEASUREMENT, Motors • stepper