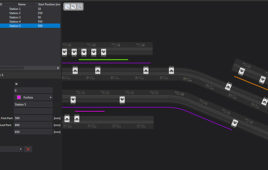
Kinetica converts tabular data into touch-friendly format.
 Pittsburgh—Spreadsheets may have been the original killer app for personal computers, but data tables don’t play to the strengths of multi-touch devices such as tablets. So researchers at Carnegie Mellon University have developed a visualization approach that allows people to explore complex data with their fingers.
Called Kinetica, this proof-of-concept system for the Apple iPad converts tabular data, such as Excel spreadsheets, so that data points appear as colored spheres on the touchscreen. People can directly manipulate this data, using natural gestures to sort, filter, stack, flick and pull data points as needed to help them answer questions or explore hidden relationships.
“The interactions are intuitive, so people quickly figure out how to explore the data with minimal training,” said Jeffrey Rzeszotarski, a Ph.D. student in the Human-Computer Interaction Institute (HCII) who developed Kinetica with Aniket Kittur, assistant professor in the HCII. They will present their findings April 29 at the CHI Conference on Human Factors in Computing Systems in Toronto.
“People often try to make sense of data where you have to balance many dimensions against each other, such as deciding what model of car to buy,” Kittur said. “It’s not enough to see single points — you want to understand the distribution of the data so you can balance price vs. gas mileage vs. horsepower vs. head room.”
Kinetica solves this problem by taking advantage of the multi-touch capabilities of tablets. Someone sorting through data on car models, for instance, could pull all of the different models into a chart that graphs their gas mileage and horsepower. Afterward, they could put two fingers on the touchscreen to create a virtual sieve and pull it through a field of spherical data points, screening out models that don’t meet a certain criteria, such as those costing more than $20,000. Or, they could use one finger to draw a transparent lens that highlights inexpensive models.
“It’s not about giving you one way to do things, but giving you a sandbox in which to play,” Rzeszotarski said. A video showing some of the potential interactions possible with Kinetica is available on the project website, http://getkinetica.com/. Data points don’t just pop into place after they have been manipulated with Kinetica, as they do in a traditional spreadsheet. Seeing where data points come from as they are sorted can give the user deeper insights into relationships, according to Kittur and Rzeszotarski. For instance, when a user drags a virtual sieve across points to filter them, they can watch as the points are screened out. Outliers — data points that don’t fit with most of the others — also can be readily identified.
In user studies, people using an Excel spreadsheet to analyze data typically made about the same number of observations within a 15-minute time span as did Kinetica users, Rzeszotarski noted. But the Kinetica users had a better understanding across multiple dimensions of data. For instance, Excel users analyzing data on Titanic shipwreck passengers might extract facts such as the passengers’ average age, while Kinetica users would note relationships, such as the association between age and survival.
Approaches such as Kinetica could expand the functionality of tablets, they contend.
“Web browsing and book reading are among the most popular uses for tablet computers, at least in part, because the tools available for many apps simply aren’t good enough,” Rzeszotarski said. “A mouse might be superior when you’re working with a desktop computer, but tablets can accommodate much more natural gestures and apps need to play to that strength.”
Though Kinetica was developed initially for the iPad, the researchers also are exploring versions adapted to other devices.
For more information visit http://www.cmu.edu
Filed Under: M2M (machine to machine)