By David A. Hall, Senior Product Manager, National Instruments and Sherry Hess, AWR, A National Instruments Co.
Test instrumentation is fundamentally changing—the lines between electronic design automation software and test bench software are blurring. The result is a faster design process.
The concept of combining simulation software and measurement hardware in the RF and microwave product design flow has long been a highly desired, yet elusive goal. In theory, the idea of merging the design and test processes should provide clear benefit such as shorter time-to-market. However, in practice, the enabling technologies that allow engineers to use a common toolset from initial design through production test are just emerging.
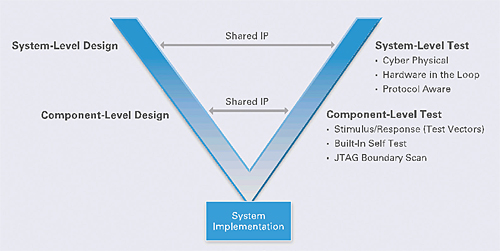
Figure 1. The V-Diagram illustrates the practice of integrating design and test processes
For years, the V-diagram has been used to illustrate the integration of design and test in industries with highly complex products—especially in automotive and aerospace/defense applications.
In these industries, where the end product is a highly complex system of systems, the left side of the V-diagram is considered design, and the right side represents test.
The idea behind the V-diagram is that greater efficiency can be achieved by beginning the test and validation of sub-systems before development of the entire system is complete. While the use of concurrent design and test approaches is common in industries with highly complex products, the practice of integrating design and test processes is now becoming popular in other industries.
Why combine simulation and measurements?
Consider the scenario of an engineer (or engineering team) assigned to a new project that requires the design of some next-generation high-performing device (IC, PCB, module or communications system). One of the first steps in the process is for the engineer to fire up his electronic design automation (EDA) software (loading in a prior/similar design or starting with a blank schematic) and rely upon it as a primary tool for modeling and optimizing the performance of the new design. In the general sense, EDA software tools are used to construct and validate the performance of virtual prototypes prior to fabrication. This class of software models behaviors of a virtual product—both at the schematic and layout level. In the simulation world, variations on design can be quickly and inexpensively realized. Through simulation and the behaviors it predicts, engineers can tune and optimize performance to meet specs (e.g. size, cost, frequency, efficiency). For example, if the engineer is designing an RF power amplifier, he’ll build his design within an EDA environment and use the simulation engines within that environment to not only predict RF performance metrics—such as gain, 1dB compression point, and third order intercept (IP3)—but also to vary the physical properties of the layout and materials to tune and optimize the performance.
Once the design has been well validated in the virtual world, the next step is to build a physical prototype of the product and test it with real instrumentation. Again, the user might measure the actual gain and 1dB compression point, but he’ll also perform more sophisticated measurements as well. For example, if his power amplifier is for an LTE cellular handset, he’ll also look at LTE-specific characteristics such as Error Vector Magnitude (EVM) and Adjacent Channel Power (ACP).
While the process described above is a typical design flow, it can be made more efficient. For example, the engineer described must correlate simulated results with measured metrics—a process that requires him to understand intimate details of how both his simulation tools and test equipment are performing their respective measurements.

Figure 2. Comparison of the EDA vs. Test Bench Architecture.
Merging simulation and testing
With the context of how engineers currently use EDA software and test equipment within the product development flow, let’s take a look at how new connectivity between EDA and test software environments can improve the efficiency of the design process. Effectively, we can abstract the EDA software environment as a utility that uses mathematical models that predict the output of a device under test (DUT) based on the input of the DUT. Since our example product is an RF power amplifier, the “output” is a voltage, but will be measured as output power as a function of input power and frequency.
By contrast, the measurement process contains several clear similarities with how a virtual product is measured in the EDA world. For example, just as the EDA software measures and reports the virtual output of the DUT, instrumentation is used to capture similar data in the physical world. Thus, one of the clear opportunities to improve the efficiency of the development process is to reuse measurement algorithms from test equipment, for instance, earlier in the design flow process.
Historically, the reuse of measurement algorithms from test equipment earlier in the design process was virtually impossible. Decades ago, the first instruments designed to test wireless equipment were completely self-contained boxes, and lacked the flexibility to do anything but behave like an instrument.
Today, the preferred architecture of instrumentation is fundamentally changing. In contrast to fixed-functionality instruments, today’s software-defined instruments often use a PC-based architecture. At the same time, today’s EDA software environments are capable of increasing connectivity to software environments such as NI LabVIEW. For example, a new feature in AWR’s Visual System Simulator (VSS) software is a node on the diagram that enables the user to exchange data with LabVIEW diagram.
This connectivity shows how the lines between EDA and test bench software environments are being blurred. Going back to the amplifier example, recall that the final design criteria (EVM and ACP) were historically measured on a physical device and not a virtual one. However, increasing connectivity between the EDA and test software environment gives you a much wider range of measurements.
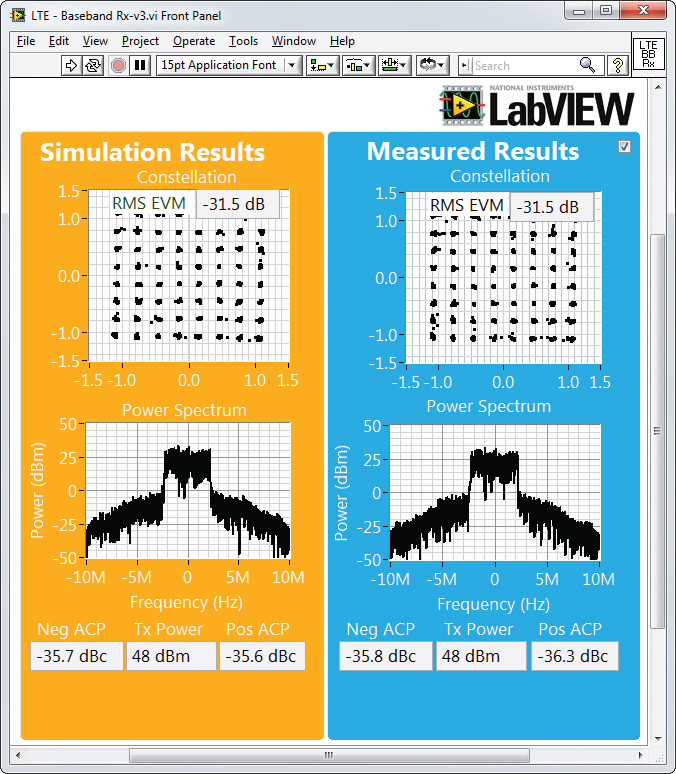
Figure 3. LabVIEW measurement algorithms can be imported directly onto the system diagram.
Figure 3 shows an example system diagram set up to test an LTE RF power amplifier. The diagram consists of three blocks, two of which are configured to talk to LabVIEW. In the first block, underlying code creates an LTE waveform used to stimulate the PA—effectively behaving as a virtual source. In the next VSS block, the sourced signal is passed through the amplifier and becomes both amplified and distorted. This second block operates as a virtual DUT—with its behavior being predicted by inherent mathematical models in the EDA environment. Finally, the output of the DUT is passed into a measurement block. In this block, an LTE demodulation and measurement algorithm is applied to the amplified/distorted LTE signal. From this block, we are able to determine LTE-specific measurement results such as EVM and ACP.
The connectivity between EDA and test environments allows for sharing measurement algorithms between the simulation and test processes. As it turns out, the measurement algorithm shown in Figure 3 is identical to the LTE algorithms used in conjunction with PXI RF signal analyzers. While this might seem trivial, consider the complexity of emerging wireless standards like 3GPP LTE. Because algorithm complexity, along with a wide range of measurement settings, can make correlating measurements difficult—even between RF signal analyzers—reusing the same algorithm in both initial design and final testing is a significant benefit. As a result of algorithm reuse, engineers can more tightly correlate simulation with measured results and more assuredly realize the right product design the first time. In Figure 4, the front panel of the LabVIEW measurement block compares measurements of an example virtual DUT with a physical amplifier prototype. The results are nearly identical.
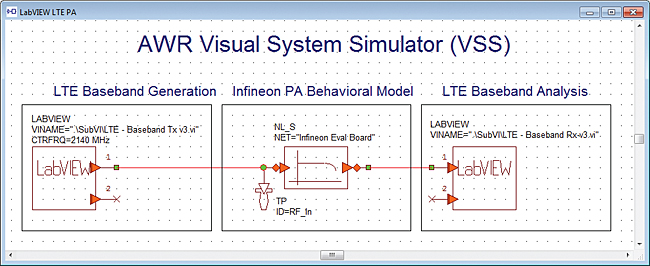
Figure 4. Simulated EDA measurements as compared with actual measured results.
In this way, engineers can compare metrics such as EVM and ACP side-by-side, providing richer data that ultimately enables them to improve their simulation technique.
National Instruments
www.ni.com
::Design World::
Filed Under: Software • simulation, TEST & MEASUREMENT




Tell Us What You Think!