By Ron Marshall for the Compressed Air Challenge
The Compressed Air and Gas Institute’s data sheets can make a real difference in helping you choose your next air compressor
Replacing your air compressor can be very confusing when it comes time to buy a new one. You’ve probably not thought about the subject for many years, but if your old unit is down, and your boss is howling, it is time to make a decision. But how do you decide the best make and model, there are so many choices?
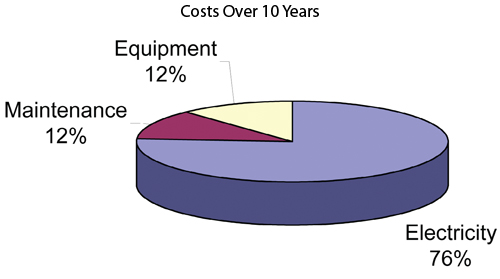
Figure 1: The 10 year operating cost of a typical air compressor is mostly energy (Compressed Air Challenge, www.compressedairchallenge.org)
There is more to the purchasing decision than the initial first cost. The price of various compressor brands and models may differ by only a few hundred dollars, making the cheapest machine the obvious choice to the purchasing department, but examining energy characteristics can reveal additional hidden costs.
A 100-hp compressor requires about $37,000 in annual electrical costs at 10 cents per kWh with a five-day, two-shift operation of about 4200 hours per year. Over a 10-year period, these costs can represent about 76% or more of the total life cycle cost of the air compressor, with the purchase price representing only 12%. Because of this even a 5% change in operating efficiency can save you $18,500 in electrical costs over 10 years.
Data sheets can help
To do adequate power cost calculations some accurate and consistent information is needed so that true costs can be calculated. This can help you make appropriate decisions about energy efficiency. In past, information about air compressors was based on a variety of test conditions, but much of it was confusing and conflicting. Fortunately, CAGI Compressor Data Sheets are now readily available from participating manufacturers that show compressor and air dryer energy consumption in a standard format.
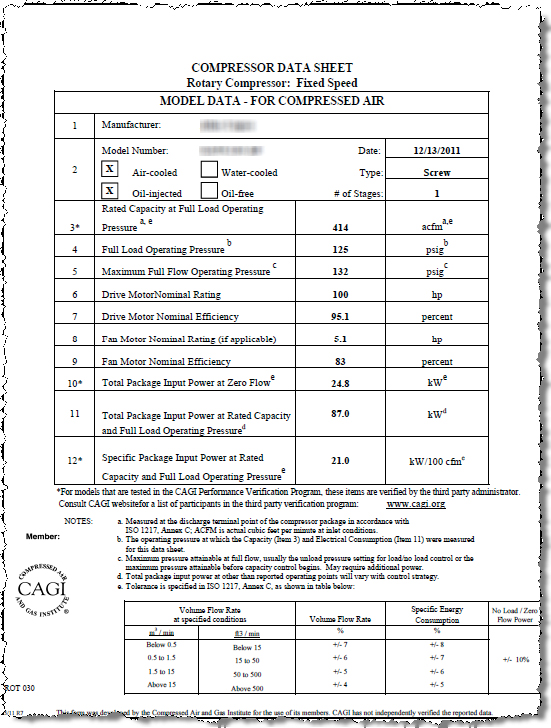
Figure 2: Typical CAGI Data sheet for a fixed speed, lubricated screw compressor
Figure 2 shows sample CAGI data for a typical 100-hp, 125 psi air-cooled, fixed-speed lubricated rotary screw air compressor. Using this information, you can make estimates of the electrical needs of this compressor if its annual operating hours are known. Figure 3 shows comparisons of other compressors, one from the same company, and similar sized compressors from four other manufacturers. You can see the numbers vary, but the common ground is specific power. Specific power is like a gas mileage rating for compressors, showing the total package power input kW of a complete compressor package, including cooling fans, pumps, and other electrical loads for every 100 cfm of compressed air output.
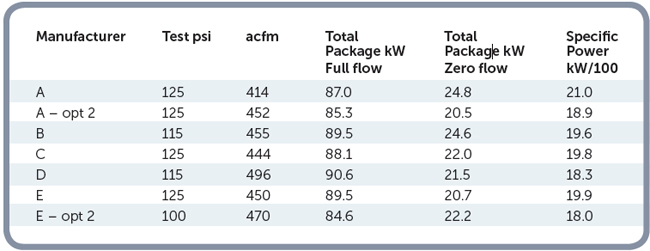
Figure 3: Specific power can vary between makes and models (various selected CAGI members)
Compare carefully
Note that Figure 3 is not an exact apples-to-apples comparison. Because two of the manufacturers have chosen to test their compressors at 115 psi this lower pressure results in lower specific power numbers by about 5%. The numbers would have to be adjusted for a common pressure by about 1% for every 2 psi increase in pressure to compare fairly. Manufacturers should be consulted to provide assistance finding out the actual package kW consumption at the chosen pressure. Lower than rated operating pressure results lower kW consumption for fixed speed compressors. For some VSD-controlled machines, the lower pressure my result in the same power consumption but more cfm output through automatically programmed increases in maximum speed.
An additional item has been placed in Figure 3 as Item E for interesting comparison; a 100-psi rated compressor. Its lower specific power number illustrates the savings potential if you operated your air compressor at 100 psi rather than 125 psi. The resulting 9.5% reduction would reduce the total 10-year power costs significantly. In additional to this the lower pressure will cause unregulated compressed air flows to reduce resulting in even more savings of about 0.9% for every psi reduced.
Part loads
If the compressor in question is operating at part load in load/unload trim duty, a special kind of calculation is required to determine the specific power that takes the effective storage receiver capacity of the system into account. Figure 4 shows the relative power consumed by a lubricated screw compressor with varying system storage sizes at different part load percentages. These curves typically apply to lubricated screw compressors with a 40-second blow down time and 10 psi wide pressure band but can vary with conditions.
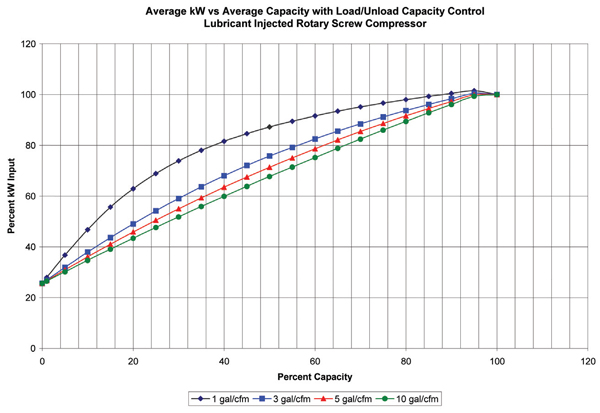
Figure 4: Part Load Performance of typical lubricated screw compressors, load/unload control
(www.compressedairchallenge.org)
One can see, for example, that at three gallons per cfm capacity the part-loaded air compressor would consume 75% of its full load power while delivering 50% of its full load flow. This would mean the specific power at the 50% point would be roughly 50% higher than at full load. At a lower load of 25% of full load the power consumption would be about 55% of full load, resulting in a specific power that is more than double the full load number.
Evaluation of VSD power consumption
A new type of CAGI data sheet for VSD compressors has been recently developed for use by CAGI members. Figure 5 shows a table and curve from a sample data sheet for a 100-hp, 125-psi rated VSD style screw compressor.
Comparing this VSD curve with the numbers in Figure 3 shows this VSD unit would operate in the mid-range of the specific power numbers if it operated at 100% load. However, at 50% load it would have a very attractive number in the 20 kW per 100 cfm range, much better than a 31 kW/100 number for a partly loaded load/unload screw compressor following the 3 gal/cfm line in Figure 4. At lower percent loading the difference in efficiencies would be even more pronounced. This is the big benefit of VSD control, better efficiency at part loads.
The shapes of the various VSD curves can vary between compressors, with some units having very flat curves and smaller turndown ranges, while others may have wider but steeper curves yielding less attractive specific power numbers at lower flows. When comparing the energy consumption between various units the curve shape can make a significant difference depending on the actual compressed air demand so they shouldn’t be ignored. The new style CAGI Compressor Data Sheets for VSD compressors are valuable resources to assist you selecting the best option for your investment.
Example comparison
Consider the following simplified example calculations using a basic load profile where two different options are compared. Typical load profiles are much more complex than this. The load profile is estimated to be 600 cfm for 3000 hours, 200 cfm for 2500 hours, and the system has about 3 gal per cfm storage (1200 gal). This profile estimate might be the result of a compressed air audit by a qualified specialist. To adequately supply this profile the system would require two running 100-hp compressors for the 600 cfm flow but would only need a single compressor part loaded at the lower 200 cfm flow. The following calculations assume the compressor control strategy automatically turns off the second unit when it is not required. The energy required at the various loads is calculated using the specific power numbers for each compressor.
Two fixed speed
Consider Option 1, using two fixed speed compressors with the characteristics similar to Item A in Figure 3 producing 414 cfm at 21.0 kW/100 cfm. One compressor would be fully loaded at the higher flow with the second unit covering the remaining flow of 186 cfm (600 – 414 = 186 cfm). This trim compressor would be 45% loaded. The kWh for the fully loaded compressor is calculated as follows:
kWh = (cfm x specific power x hours)/100 = (414 x 21.0 x 3000)/100 = 260,820 kWh
For the trim:
Specific power at 45% load would be 33.6 kW/100 cfm (72% of FL power at 45%) from Figure 4.
kWh = (cfm x specific power x hours)/100 = (186 x 33.6 x 3000)/100 = 187,490 kWh
For the 200 cfm load:
Specific power at 48% load (200/414) from Figure 4 = 32.8 kW/100 cfm
kWh = (cfm x specific power x hours)/100 = (200 x 32.8 x 2500)/100 = 164,000 kWh
Total for all hours = 612,310 kWh
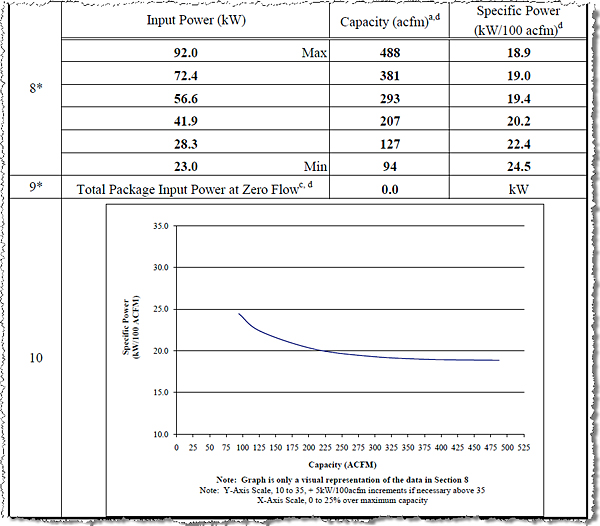
Figure 5: Typical VSD curve from 125 psi CAGI data sheet (CAGI)
Option 2 One fixed speed and one VSD
This example uses Item A Option 2 in Figure 3 as base load and the VSD compressor from Figure 5 as trim. One compressor would be fully loaded at the higher flow with the trim unit covering the remaining flow of 148 cfm (600 – 452 = 148 cfm). This trim compressor would be 30% loaded. Energy consumption would be calculated as follows:
kWh = (cfm x specific power x hours)/100 = (452 x 18.2 x 3000)/100 = 246,790 kWh
For the trim:
Specific power at 30% load would be 21.8 kW/100 cfm from Figure 5.
kWh = (cfm x specific power x hours)/100 = (148 x 21.8 x 3000)/100 = 96,790 kWh
For the 200 cfm load:
Specific power of the VSD at 41% load (200/488) from Figure 5 = 20.2 kW/100 cfm
kWh = (cfm x specific power x hours)/100 = (200 x 20.2 x 2500)/100 = 101,000 kWh
Total for all hours = 444,600 kWh
Savings Option 2 vs. Option 1 = 612,310 – 444,600 = 167,610 kWh
At 10 cents per kWh, Option 2 would represent a 27% savings in electrical costs worth $16,610 per year over Option 1. Further savings could be gained by addressing other items like air dryers, filters, piping pressure drop, leaks and inappropriate end uses.
If Option 2 costs $20,000 more per year to implement, the return on investment would be slightly more than one year.
The resources available from the CAGI data sheets and Compressed Air Challenge materials can assist you’re the compressed air user to evaluate your options when replacing compressors. There are more CAGI resources available to help you do similar calculations with air dryers too.
Compressed Air Challenge
www.compressedairchallenge.org
Filed Under: Pneumatic equipment + components, FLUID POWER

Dear sir,
We have a rotary screw compressor capacity of 132 kw ,5.5 bar pressure and 925 cfm. Our compressor is running always with running hours 32549 and load hours is 2322 only. In this operation we are loosing huge power losses. How we can save the power consumption.
Consider more storage capacity, buying a much smaller compressor (probably 22kW will be enough – need more data) when the 132kW compressor reaches its end of life, or changing the capacity control method from load/unload to inlet valve modulation or VSD.
How to calculate electric saving through different different size of PU tube, like air leakage in 8mm tube continuously if I closed the leakage than how can I say that how many energy saved
How to measure saving after air leakage finding e fixing program?!
How to calculte CFM.Load pressure 6.3 bar and unload pressure 6.6 bar . Compressor is 45 K/W.
How to calculate electric saving through different different size of PU tube, like air leakage in 8mm tube continuously if I closed the leakage than how can I say that how many energy saved
Sir we 2500cfm how many kw we used
we have a rotary screw compressor capacity of 90 kw ,5.5 bar pressure and 925 cfm. Our compressor is running always with running hours 32549 and load hours is 2322 only. In this operation we are loosing huge power losses. How we can save the power consumption.
How to calculate and formula for Reducing air pressure form 6 bar to 5 bar in reciprocation air compressor 2 stage 75 KW driving power motor.
Pl do needful how to calculate in reduction of Pressure in Reciprocation air compressor.
we are Using Gardener Denver HP 75, Air
would like to know Air Dryer air flow rate ?
and how to calculate
if possible reply to me Urgently
tks
I have a VMD1500 Air Compressor
Maximum Pressure = 6.9 bar
Compressor shat speed = 570 rpm
I would like to know Kw/h need to produce 1 CFM?
Sir
We have 600 cfm consumption per day. So many power KWH is used per day