by Nate Bloomingdale, Technical Specialist
A spectroradiometer can be a useful instrument in testing LEDs and LED lighting systems before implementation both in the lab and in the field. A spectroradiometer can provide reliable LED metrology for comparison to conventional lighting options.
A light-emitting diode (LED) is a fourth generation light-sources that are increasingly popular because of long-life advantages, and reliable operation. When compared with traditional lighting technologies such as incandescent, fluorescent, high-intensity discharge (HID), high-pressure sodium (HPS), and other lighting technologies, its overall costs are lower. LEDs have long been used as indicator lights in a range of consumer and machinery display/control products. In automotive they are moving from dashboard and interior lights to headlights, taillights, flashers, and signal indicators.
LEDs are basically a p-n junction that emits light when current is applied. An LED consists of a die of semiconductor material impregnated, or doped, with impurities. When the LED is switched on, current flows from the anode (p side) to the cathode (n side). At the junction, higher energy electrons fill lower energy “holes” in the atomic structure of the cathode material due to the voltage differences across the electrodes. The energy released produces both light and heat. Light is reflected upward and the heat is transferred downward to the base of the LED and eventually dissipated.
The chemical composition of the semiconductor determines the light color produced by the LED. An epoxy resin enclosure focuses the light and protects the LED, making it virtually indestructible. As a solid-state device, it is a very reliable producer of light. In addition, it uses less energy, can be a much smaller size with an easy-to-use form factor, has faster switching, and great durability.
The development of high-brightness LEDs (HBLEDs) has accelerated market demand. HBLEDs have introduced a number of improvements:
• Longer lifetime (50,000 to 100,000 hours)
• Improved heat dissipation
• Lower cost
• Compatibility with RoHS standards (no mercury, no lead)
• Brightness – more than 50 lumens possible
• HBLEDs are available in both blue and white.
Most LEDs are monochromatic with different semiconductor materials emitting light in different wavelengths. LEDs emit a pure color in a narrow frequency range identified by peak wavelength and measured in nanometers (nm). LED light wavelengths range from blue at 400 nm to infrared at 800 nm. LED colors are typically red, orange, amber, yellow, green, blue, and white (composed of red/green/blue – RGB). Different LED chip technologies emit light in specific regions of the visible light (VIS) spectrum, producing unique intensity levels.
For producing white light LEDs, manufacturers typically apply a yellow phosphor to a blue LED. The phosphor changes some of the blue emission to yellow and to the human eye the result appears white. The exact color temperature of the light is driven in part by phosphor thickness and concentration. The variations in “white” LEDs are usually more of an issue than in color LEDs.

The SPECTRAL EVOLUTION PSR-3500 spectroradiometer is for measuring LED chromaticity and luminosity.
Consistency and Binning
As with any technology, in addition to advantages, there are drawbacks. Consistent manufacturing of LEDs with the same or similar optical properties is almost impossible – even for LEDs in the same batch. Brightness and color can both vary from component to component. Output is also affected by encapsulation, the efficiency of different wafer lots, and other process variables.
To maximize yield despite the inherent variations, manufacturers sort LEDs by luminous flux and either chromaticity or color. LEDs are typically characterized by manufacturers in bins based on these criteria using the CIE 1931 x, y chromaticity standard for comparing the color of LEDs as interpreted as a series of chromaticity quadrangles that define a maximum allowable color variation. The quadrangles correspond to correlated color temperatures (CCT) that mimic white light sources ranging from cool to warm. LEDs within these bins can vary across acceptable performance ranges. Part of the engineer’s task in using LEDs is ensuring that they will perform to the criteria required. Dealing with binning is part of the challenge.
Testing of LEDs for light intensity/brightness and color is important to successful use in all applications.
Parameters for Consideration
Some of the major LED parameters that should be considered in any application can include the following:
Color
Typical process variations can give peak wavelength variations up to +/-10nm. Sensitivity to color variation is most acute around 560-600nm – in the yellow to orange range and should be considered in choosing the color and sometimes the position of LEDs.
Light Intensity
Light intensity of the LED is a factor of the chip design and material, current level, encapsulation, and other variables. While not particularly important in applications for instrument clusters and other indicators, it is important in lighting applications. The intensity value for an LED is related to a given current. Light output increases as current increases.
Current/Voltage
It is important to stay within the maximum current rating parameters. Increasing current will increase output, but will also increase heat. Excess heat has a detrimental effect on output, color, and useful lifecycle.
Angle of View
The total lighting output of an LED is a factor of light intensity plus viewing angle. An LED lamp with a larger viewing angle (where more of the light is distributed across a wider area) will have a higher total light output than an LED lamp with the same intensity, but a narrower angle of view.
Operational light
Unlike conventional lighting systems where rated average life for a lamp is the point at which half the lamps fail, useful life for an LED is hard to estimate since catastrophic failure takes so long to occur. In fact, LED light sources continue to give light even after their initial lumen output has decreased by 50%. To determine knowing how long an LED fixture will retain a considerable percentage of its initial luminosity, lumen maintenance measurements are used instead of meantime to failure measurements. The lumen maintenance specification for an LED is typically the time it takes for an LED to reach 70% of its illumination. This 30% reduction in light output is considered to be at the threshold for visually detecting a gradual reduction in light output.
Testing LEDs Using a Spectroradiometer
A spectroradiometer measures the wavelengths of individual colors of light. In LED metrology, it can measure output in lumens, watts, footcandles, moles per second, and more. A portable UV/VIS/NIR spectroradiometer provides a useful tool for quickly testing and characterizing LEDs and LED luminaires. It can test an LED for optical output in watts as a function of varying LED current, temperature, and other optical characteristics to completely characterize the LED or LED system. Important spectroradiometer capabilities for LED test applications include:
• Fast, full spectrum UV/VIS/NIR measurements with a spectral range from 350 – 2500nm with a single scan<
• Fast scanning with autoshutter, autoexposure, and auto-dark correction before each new scan – without requiring repeat optimization steps
• Fixed array detectors for reliable operation
• Lightweight and portable for lab or field use
• Standalone operation or use with a laptop or personal digital assistant (PDA)
• Bluetooth for easy communications
• Superior signal to noise ratio with faster scan times and better reflectance measurement
• NIST-traceable calibration for taking a wide range of irradiance and color measurements to fit all the application specifications
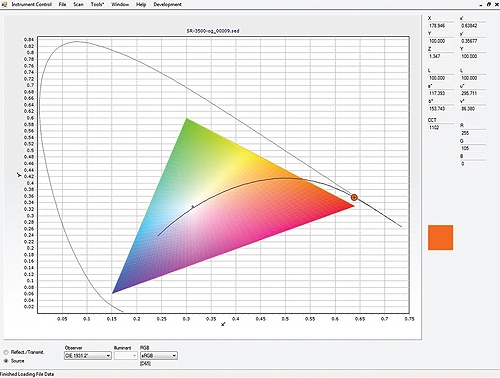
Calculating chromaticity coordinates and correlated color temperature of a spectral dataset.
In addition, the system would have the following colorimetry capabilities built-in:
• CIE 1931 chromaticity diagram with sRGB gamut
• Scan results displayed graphically with a cross hair overlay
• Text display of x, y, XYZ, and RGB coordinates and correlated color temperature

Measuring and comparing the spectral radiance of an LED (red) versus a halogen (blue) light source.
The ability to quickly test for brightness and chromaticity in the lab or in the field allows for rapid screening of LEDs before use and offers a method for gauging color shift over projected lifecycle, where color and hues are critical. Since LEDs tend to shift color over time, measuring color stability can be a key in many applications. It is also useful to compare the brightness and color of LEDs versus incandescent, fluorescent or halogen lamps early in the design process, before the LEDs are used as substitutes for these conventional lighting technologies.
Testing on signal light brightness in this application also includes color saturation measurement, since that characteristic increases the perception of brightness. In tests, brightness/luminous intensity ratio values for white, green, and blue LED signal lights relative to currently used incandescent lights of the same nominal color indicated that the LEDs were generally judged brighter to the human eye. These results could then be used to develop a general model for testing signal lights of any chromaticity within the established color boundaries to ensure that brightness/luminous intensity parameters were met.
Inasmuch, the chromaticity boundaries for white light were adjusted to extend less into the “yellow” region and slightly further into the “blue” region. In this and other tests, pilot observation of the chromaticity of different LEDs was investigated and included.
LED lighting is increasingly used as a replacement for conventional lighting technologies. To take advantage of the benefits for lower cost, environmentally friendly use, longer life, good color characteristics, lack of warm-up time, improved vision conditions and more, rigorous testing is required. The nature of LED manufacturing itself introduces variables that affect the brightness and color ouput of the LED.
Spectural Evolution
www.spectralevolution.com
Filed Under: Lights • signal lamps • indicators, ELECTRONICS • ELECTRICAL

Tell Us What You Think!