Hurricane Maria was analyzed in visible and infrared light as NASA-NOAA’s Suomi NPP passed overhead over two days. NASA’s GPM satellite also provided a look at Maria’s rainfall rates.
On Sept. 23 at 8:12 a.m. EDT (1212 UTC) the Global Precipitation Measurement mission or GPM core observatory estimated of hourly rainfall in multiple intense rainfall bands of thunderstorms around Maria’s western side. Rain was found falling at a rate of over 6.57 inches (137 mm) per hour and some thunderstorm tops in these rain bands were found to reach heights above 9.7 miles (15.7 km). GPM is managed by NASA and the Japan Aerospace Exploration Agency.
On Sept. 24 at 1:54 p.m. EDT (1754 UTC) the Visible Infrared Imaging Radiometer Suite (VIIRS) instrument aboard NASA-NOAA’s Suomi NPP satellite captured a visible light image of Hurricane Maria that showed the eye had become cloud filled. Maria was located northeast of Bahamas and far off the Florida east coast.
On Sept. 25 at 2:12 a.m. EDT (0612 UTC) the VIIRS instrument aboard NASA-NOAA’s Suomi NPP satellite provided tan infrared image of Hurricane Maria. The Infrared image provided forecasters with temperature data that showed where the strongest storms were located within the hurricane. Coldest clouds tops and strongest storms were in the southeastern quadrant where temperatures were as cold as or colder than minus 80 degrees Fahrenheit (minus 62.2 Celsius). NASA research has shown that storms with cloud top temperatures that cold can produce heavy rainfall.
On Sept. 25, National Hurricane Center forecaster Daniel Brown noted “Deep convection is primarily confined to the eastern semicircle of the circulation and the radius of maximum winds has significantly increased.”
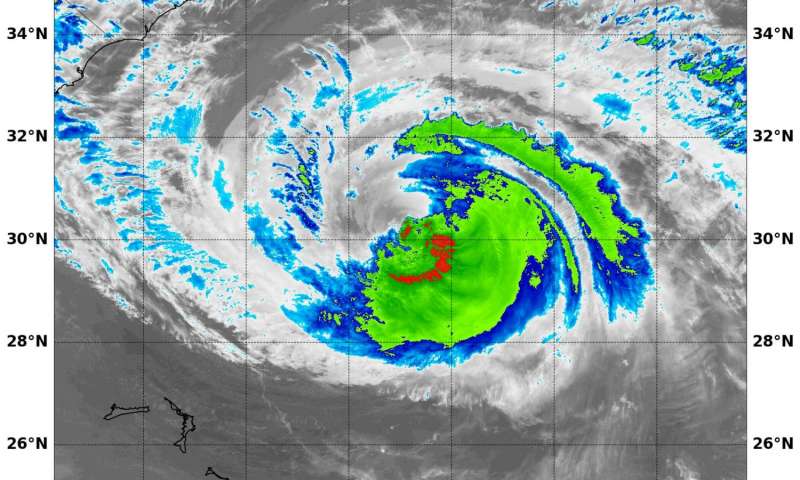
On Sept. 25 at 2:12 a.m. EDT (0612 UTC) the VIIRS instrument aboard NASA-NOAA’s Suomi NPP satellite provided this infrared image of Hurricane Maria. Coldest cloud tops (red) and strongest storms were in the southeastern quadrant. (Image Credit: NASA)
Watches and Warnings in Effect
On Sept. 25 there were a number of Watches and Warnings in effect. A Tropical Storm Warning is in effect for Cape Lookout to Duck, North Carolina and the Albemarle and Pamlico Sounds. A Tropical Storm Watch is in effect for north of Duck to the North Carolina/Virginia border and from north of Surf City to south of Cape Lookout.
A Storm Surge Watch is in effect from Cape Lookout to Duck.
Maria’s Location and Status on Sept. 25
At 11 a.m. EDT (1500 UTC), the center of Hurricane Maria was located near 31.2 degrees north latitude and 72.9 degrees west longitude 72.9 West.
Maria was moving toward the north near 7 mph (11 kph), and this general motion with some decrease in forward speed is expected through Tuesday night.
Reports from an Air Force Reserve Hurricane Hunter aircraft indicate that maximum sustained winds are near 80 mph (130 kph) with higher gusts. Gradual weakening is forecast during the next couple of days and Maria is forecast to become a tropical storm
Tuesday night, Sept. 26. Maria is a large hurricane. Hurricane-force winds extend outward up to 90 miles (150 km) primarily to the east of center and tropical-storm-force winds extend outward up to 230 miles (370 km).The latest minimum central pressure reported by reconnaissance aircraft is 963 millibars.
Dangerous Ocean Conditions on U.S. East Coast
Swells generated by Maria are affecting portions of the coast of the southeastern United States and Bermuda and will be increasing along the Mid-Atlantic and southern New England coasts today. Swells also continue to affect Puerto Rico, the northern coast of Hispaniola, the Turks and Caicos Islands, and the Bahamas. These swells are likely to cause life-threatening surf and rip current conditions.
Maria’s Forecast Track
On the forecast track, the center of Maria will move well east of the southeast coast of the United States during the next day or so.
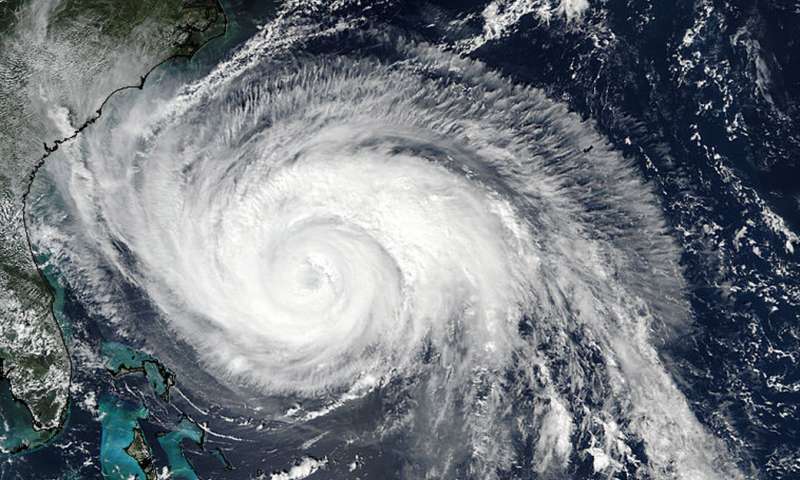
On Sept. 24 at 1:54 p.m. EDT (1754 UTC) the VIIRS instrument aboard NASA-NOAA’s Suomi NPP satellite provided this visible image of Hurricane Maria when it was northeast of Bahamas and east of the Florida east coast. (Image Credit: NASA)
Filed Under: Aerospace + defense