A NASA-produced map of areas likely damaged by the Sept. 19 magnitude 7.1 Raboso earthquake near Mexico City has been provided to Mexican authorities to help responders and groups supporting the response efforts. The quake, which struck 75 miles (120 kilometers) southeast of Mexico City, caused significant loss of life and property damage.
To assist in the disaster response efforts, scientists at NASA’s Jet Propulsion Laboratory and Caltech, both in Pasadena, California, obtained and used before-and-after interferometric synthetic aperture radar (InSAR) satellite imagery of areas of Central Mexico, including Mexico City, affected by the quake, to identify areas of damage and produce what is known as a Damage Proxy Map. The imagery — acquired before the quake on Sept. 8, and again on Sept. 20, 2017, just 6-1/2 hours after the earthquake — is from the radar instrument on the Copernicus Sentinel-1A and Sentinel 1-B satellites operated by the European Space Agency. The map may be viewed and downloaded in full resolution at:
https://www.jpl.nasa.gov/spaceimages/details.php?id=pia21963
and
http://aria-share.jpl.nasa.gov/events/20170919-M7.1_Raboso_Mexico_EQ/DPM/
The views indicate the extent of damage caused by the earthquake and subsequent aftershocks, based on changes to the ground surface detected by radar. The color variations from yellow to red indicate increasingly more significant ground and building surface change. The map should be used as guidance to identify damaged areas, and may be less reliable over vegetated areas. It covers an area of 109 by 106 miles (175 by 170 kilometers). Each pixel measures about 33 yards (30 meters) across.
The radar data were processed by the Advanced Rapid Imaging and Analysis (ARIA) team at JPL and Caltech. ARIA is a NASA-funded project that is building an automated system for demonstrating the ability to rapidly and reliably provide GPS and satellite data to support local, national and international hazard-monitoring and response communities.
The NASA Disasters Program, part of the Earth Science Division in the Science Mission Directorate, works with international, regional and local disaster response agencies to produce critical information products using global environmental data from NASA’s fleet of Earth science satellites and other airborne and space-based assets. Dedicated teams of Earth-observation disaster specialists at NASA centers mobilize to respond in real-time to a wide range of natural hazards and human-produced events.
Using space-based imagery of disasters, ARIA data products can provide rapid assessments of the geographic region affected by a disaster, as well as detailed imaging of locations where damage occurred. Radar can “see” through clouds day and night and measure centimeter-level ground movements.
Preliminary validation of the Raboso quake Damage Proxy Map was done by comparing it to a crowd-sourced Google Map. Sentinel-1 data were accessed through the Copernicus Open Access Hub. The image contains modified Copernicus Sentinel data (2017), processed by ESA and analyzed by the NASA-JPL/Caltech ARIA team.
The Sept. 19 Mexico quake occurred just 12 days after a separate magnitude 8.1 earthquake struck Mexico’s southern Pacific coast, also resulting in significant loss of life and property damage. The JPL/Caltech team had previously produced and made available a similar Damage Proxy Map for the Sept. 7 quake, along with other supporting products using satellite radar data.
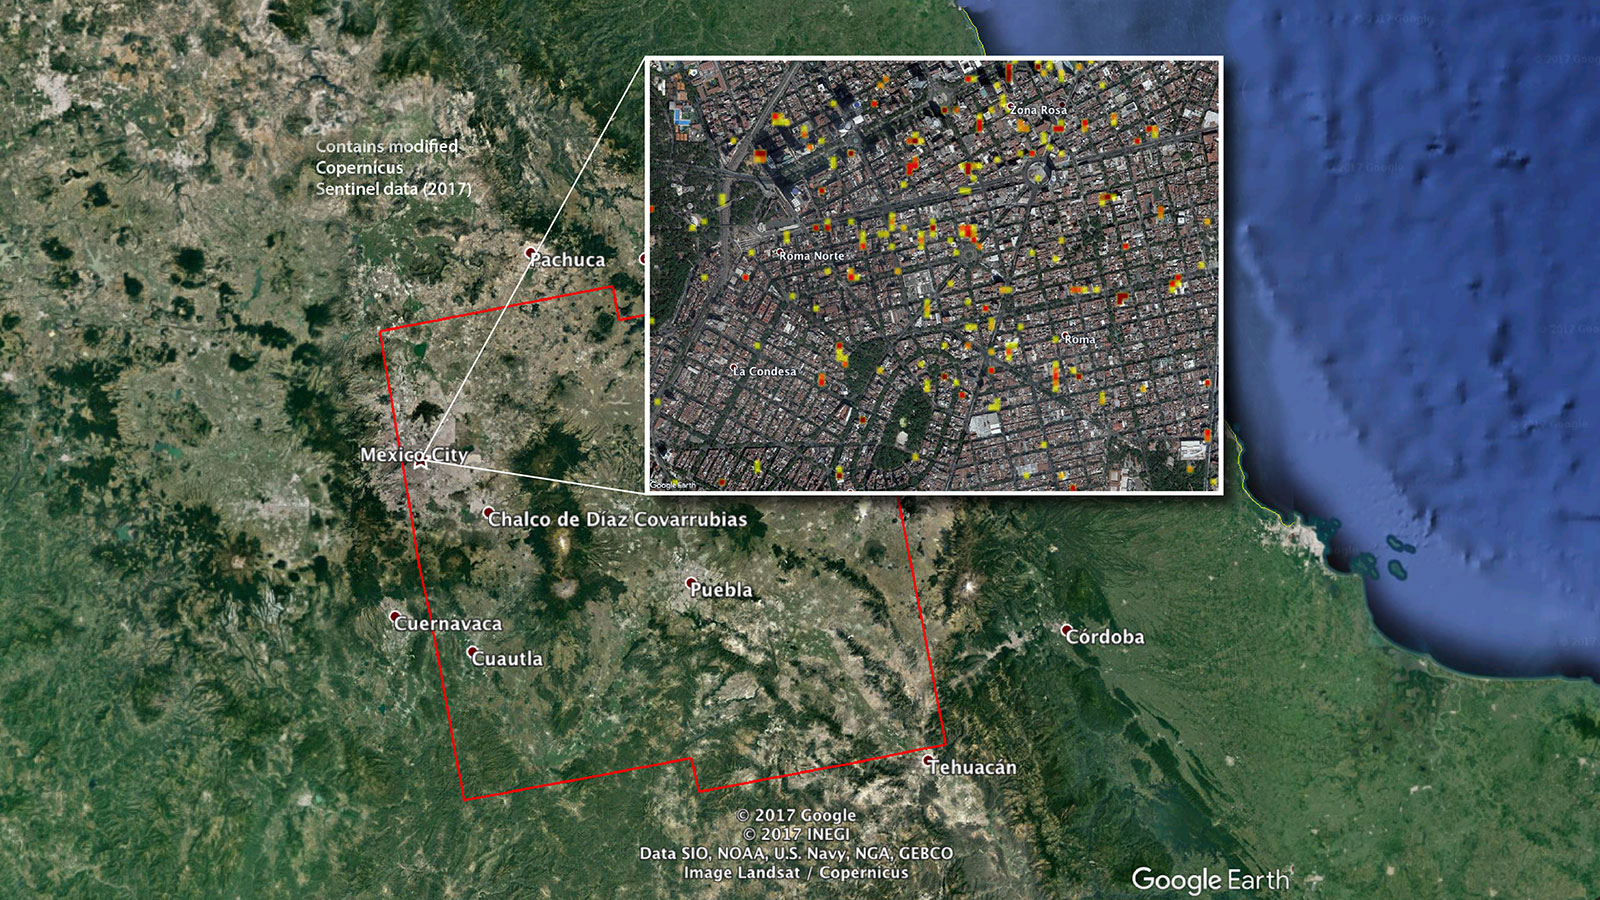
NASA/JPL-Caltech-produced map of damage in and around Mexico City from the Sept. 19, 2017, magnitude 7.1 Raboso earthquake, based on ground and building surface changes detected by ESA satellites. Color variations from yellow to red indicate increasingly more significant ground surface change. (Image Credit: NASA)
Filed Under: Aerospace + defense