After Hurricane Maria tore across Puerto Rico, it quickly became clear that the destruction would pose daunting challenges for first responders. Most of the electric power grid and telecommunications network was knocked offline. Flooding, downed trees, and toppled power lines made many roads impassable.
In circumstances like this, quickly knowing where the power is out—and how long it has been out—allows first responders to better deploy rescue and repair crews and to distribute life-saving supplies. And that is exactly why teams of scientists at NASA are working long days to make sure that groups like the National Guard and the Federal Emergency Management Agency (FEMA) get high-quality satellite maps of power outages in Puerto Rico.
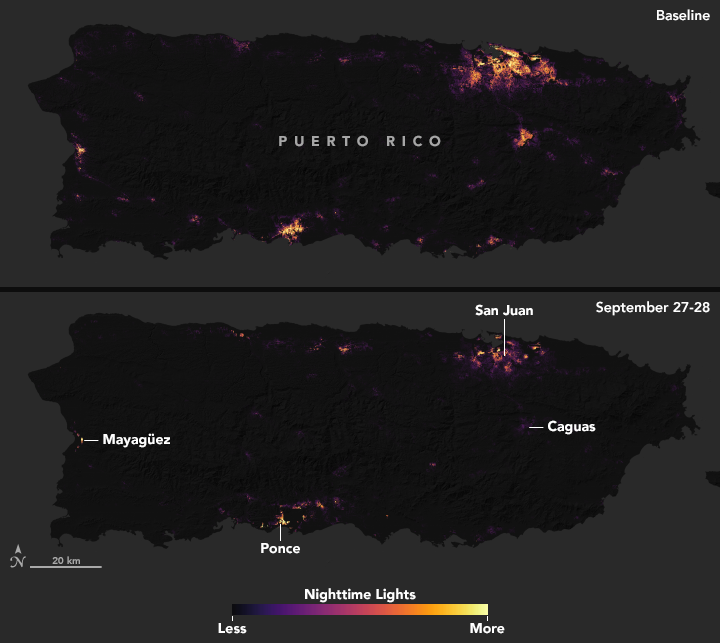
These before-and-after images of Puerto Rico’s nighttime lights are based on data captured by the Suomi NPPsatellite. The data was acquired by the Visible Infrared Imaging Radiometer Suite (VIIRS) “day-night band,” which detects light in a range of wavelengths from green to near-infrared, including reflected moonlight, light from fires and oil wells, lightning, and emissions from cities or other human activity.
The images above show lighting around San Juan, capital of the commonwealth; the images below show the entire island. One image in each pair shows a typical night before Maria made landfall, based upon cloud-free and low moonlight conditions; the second image is a composite that shows light detected by VIIRS on the nights of September 27 and 28, 2017. By compositing two nights, the image has fewer clouds blocking the view. (Note: some clouds still blocked light emissions during the two nights, especially across southeastern and western Puerto Rico.) The images above show widespread outages around San Juan, including key hospital and transportation infrastructure.
(Image Credit: NASA)
Note that these maps are not showing raw imagery of light. A team of scientists from NASA’s Goddard Space Flight Center and Marshall Space Flight Center processed and corrected the raw data to filter out stray light from the Moon, fires, airglow, and any other sources that are not electric lights. Their processing techniques also remove as much other atmospheric interference—such as dust, haze, and thin clouds—as possible.
To make the VIIRS data more useful to first responders, the Goddard team scaled the observations onto a base map that emphasizes the locations of streets and neighborhoods. The base map makes use of data collected by the Landsat, Sentinel-2, TanDEM-X, and TerraSAR-X satellites. It also incorporates high-resolution data from OpenStreetMap to show the precise locations of streets and neighborhoods.
“It is critical that we get this processing done quickly, so that we can provide the cleanest and most useful imagery to the National Guard, FEMA, and other first responders,” said Miguel Román, who is leading the effort from Goddard. “Uncorrected images can be misleading because of things like cloud cover and changing moonlight conditions.”
Román’s team is also working closely with colleagues from the Short-term Prediction Research and Transition Center (SPoRT) at NASA Marshall, as well as NASA’s Earth Science Disasters Program, to develop and share data products with first responders.
“The expertise of the SPoRT team focuses on helping end users make effective decisions from innovative NASA, NOAA, and partner data products,” said Andrew Molthan, co-investigator of the SPoRT Center. “It has been rewarding to work with Goddard colleagues on solutions that can assist with response efforts.”
Jordan Bell of the SPoRT team, for instance, has developed a product in conjunction with Esri that will display corrected and updated VIIRS observations of nighttime lights on a daily basis and include cloud mapping as detected by NOAA’s VIIRS cloud detection algorithms.
Note that these high-definition black marble maps are experimental. They are designed to make it easier to monitor neighborhood-scale outdoor features; they should not be used to monitor power outages in individual buildings or roads.
These interactive maps can be viewed here:
https://www.arcgis.com/apps/MapSeries/index.html?appid=6135434f7ffe4b13b815afc6dd052eb3
Filed Under: Aerospace + defense