New techniques let engineers examine high-speed data traffic without garbling signals.
Darshan Mehta, Tektronix Inc.
The only way advanced driver-assistance systems (ADAS), smart safety systems, and autonomous vehicle functions can be practical is through use of reliable in-vehicle networking and high-bandwidth connections. Cars can now contain as many as 100 electronic control modules (ECUs) monitoring sensors through yards of cable harnesses. Traditional automotive networks such as CAN, CAN-FD, LIN, MOST, and FlexRay simply don’t provide enough bandwidth to support all of the devices and applications that define modern vehicles, much less the autonomous highly connected cars of the future.

The Tektronix MSO 6 Series has an analog bandwidth of up to 8 GHz, a sampling rate of 25 GS/sec, and 12-bit resolution to accurately capture Automotive Ethernet signals.
The standard being designed into most cars today is 100BASE-T1, which supports 100 Mbps operation in the noisy automotive environment. This data rate is significantly higher than traditional bus systems such as the CAN bus. Future designs will use 1000BASE-T1, at 10X the data rate. As signaling moves to higher data rates, so, too, does the need for comprehensive design validation at the system level. Validation ensures interoperability and reliable operation across the many ECUs and sensors. In the same vein, design considerations safely overlooked in the past now start to matter.

Typical full-duplex connections on Automotive Ethernet: Master and slave devices can communicate simultaneously over the same link.
System-level testing
The OPEN (One-Pair Ethernet) Alliance has defined specifications for Automotive Ethernet encompassing components, channels and interoperability, and encompassing integration of ECUs, connectors and untwisted cables. To meet reliability requirements, testing must take place under the noisy conditions found within vehicles. This kind of testing, in turn, requires that testers characterize and visualize signal integrity and traffic at the system level under real-world conditions.
Examples of where signal integrity testing at the system level might bring benefits include:
TC8 (Technical Committee 8) signal quality testing
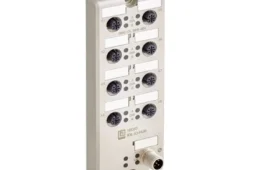
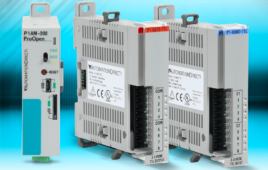
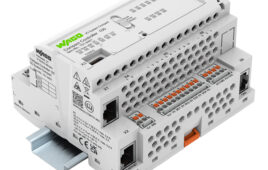
ECU component characterization and testing
Automotive Ethernet cable, connector, cable length and routing characterization and testing
Electromagnetic susceptibility (EMS) testing or Gaussian noise testing
Bulk current injection testing
Production unit testing
Automotive system impact on Automotive Ethernet performance
DC motor on/off
Engine on/off
Automotive Ethernet system debug
Ideally, you should perform signal integrity testing at the vehicle integration phase to select cables, determine optimal cable lengths and routing, check ECU performance in the presence of electromagnetic noise, etc. For visualizing the health of the system, an oscilloscope-generated eye diagram is the most valuable tool. It also provides insight on the overall health of the physical layer (PHY) and can help identify errors caused by high temperatures or noise. Also, accurate timing measurements at the system level are critical for determining latency when using gateways that convert CAN or other traditional buses to Automotive Ethernet and vice versa.
Automotive Ethernet’s 100 Mb/sec data rate calls for an oscilloscope incorporating a bandwidth of at least 1 GHz along with high sampling rates. For 1000BASE-T1, the necessary bandwidth is in the 2-GHz range. Ideally, the scope should come equipped with a PAM3 analysis software package having software clock recovery. These capabilities provide a better understanding of signal qualities for the validation and characterization of PAM3 designs having different cable lengths, noise conditions or ECU configurations.
Both full-duplex communication and PAM3 signaling, while vital to the performance of Automotive Ethernet, complicate the validation of ECUs under real-world conditions. Most serial standards operate in a simplex mode, with only one device communicating at a time, or devote separate links to the transmitter and receiver. With Automotive Ethernet, however, the master and slave device communicate simultaneously over the same link.

An Automotive Ethernet eye diagram containing master and slave signals typically looks like a garbled mess.
To analyze signal integrity over a link and decode protocols in a real system environment, automobile designers must look at each link separately. This requires separating the signals before performing analysis.
Currently, there are two methods for separating master and slave signals. The first, the traditional method, requires cutting the Automotive Ethernet cable and splicing a directional coupler in each wire of the twisted pair to separate and test the signals. Technicians must physically cut the cable to implement the test, which introduces accuracy problems.
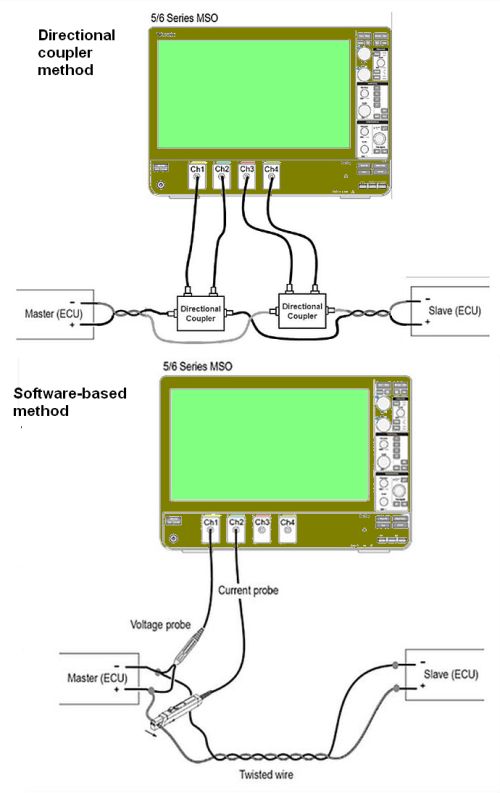
Traditional methods for separating Automotive Ethernet signals employ directional couplers spliced into the twisted pair, top. New software-based methods allow a simpler setup using just and inductive current probe and a differential probe, bottom.
More recently, test manufacturers have devised software and probes to non-intrusively separate the signals, allowing engineers to visualize the true signals with greater clarity. The connections involved consist of an inductive current probe monitoring one of the twisted-pair wires and a differential probe placed across the twisted pair.
But there have been questions about whether this new method is more accurate than the old directional coupler technique. To compare the two directly, we first ran tests using the software-based method. We then cut the Automotive Ethernet cable and inserted directional couplers with SMA connectors. We used the same test conditions and compared the test outcomes.
The eye diagram obtained using a directional coupler illustrates the impact of insertion and return loss. The max amplitude is just 100 mVpp as the directional coupler and the insertion and return loss close the eye diagram.

Top, an eye diagram of a master signal, extracted from directional couplers, illustrates the impact of insertion and return loss. Bottom, software-based separation of Automotive Ethernet signals results in eye diagrams much cleaner than those generated from directional couplers.
Peak-to-peak comparison
A comparison of peak-to-peak voltages shows a significant amplitude difference between the two methods. When using the directional coupler, the amplitude was approximately 90 mVpp for the master and 85 mVpp for the slave. In comparison, the software approach had an amplitude of approximately 1.5 Vpp for the master and 1.45 Vpp for the slave. Thus the directional coupler reduced signal strength by 20 dB, a significant loss when evaluating edge cases.
Test personnel must compensate for the insertion and return loss introduced by the directional coupler. The resulting de-embedding process can be time consuming and challenging. It should also be noted that it can be challenging to cut the cable and install directional couplers when working in a real vehicle.
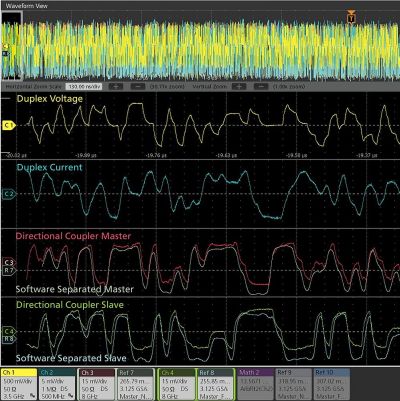
A comparison of peak-to-peak voltage shows a 20-dB loss due to the directional coupler.
It is useful to review of few of the more advanced tests made accessible via the software-based method. For example, the 100/1000BASE-T1 specification defines a return Loss measurement that requires a VNA. Automotive Ethernet test software allows the designer to perform return loss measurement using an oscilloscope, reducing the need for additional test equipment.
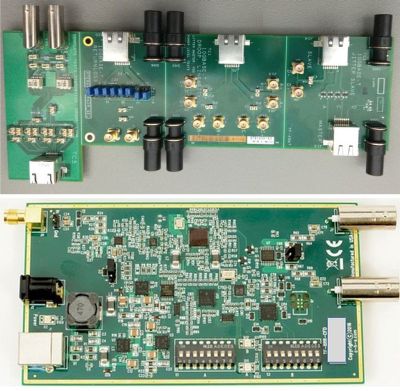
Because PHY frequencies are in the gigahertz range, test probes can cause line reflections and other distortions that can garble measurements. Tektronix recommends using its TF-XGbT Ethernet fixture (top) and TF-BRR-CFD clock divider fixture (bottom) to minimize distortion when making connections to Ethernet transmitter output and reference clock signals .
Another portion of the spec defines a return loss test that determines how much Ethernet line impedance differs from the differential impedance specification of 100 Ω, because mismatches will affect hardware interoperability. A VNA can run this test but an oscilloscope equipped with the software solution can perform it as well, no VNA required.
One last example is that of power spectral density (PSD) measurements. Built-in oscilloscope software computes the spectra of an input signal. Post processing on the signal yields the PSD. The computed PSD is then compared with the specification using masks.
You may also like:


Filed Under: Automotive, Test & Measurement Tips, MOTION CONTROL, TEST & MEASUREMENT