by BEHRAD BAGHERI, NSF I/UCRC for Intelligent Maintenance Systems (IMS) and JAY LEE, University of Cincinnati
The real value of the IoT for manufacturers will be in the analytics arising from cyber-physical models of machines and systems.
A couple decades ago, smart appliances only belonged to sci-fi movies. But rapid advances in technology made it practical to connect sensors and physical assets to networks. We have now progressed to the Internet of Things (IoT) where embedded sensors are in charge of collecting data from ever more physical assets. This process is generating a massive amount of data.
Unfortunately, the technology for storing such a gigantic amount of data is inadequate to cover all the data being generated daily. Similarly, the analytical approaches in wide use are not mature enough to intelligently and efficiently process all the generated data. This problem has been known as the Big Data challenge. To understand its magnitude, consider the 2014 annual report on Big Data by EMC and IDC, which found in 2013 that the digital universe generated 4.4 zettabytes (1 ZB = 1 billion TB) of data. In that same year, only 7% of 187 billion connectable assets were actually connected. Predictions are that by 2020, 15% of 212 billion connectable assets will be hooked up and will generate about 44 ZB of data, a factor of ten increase in seven years.
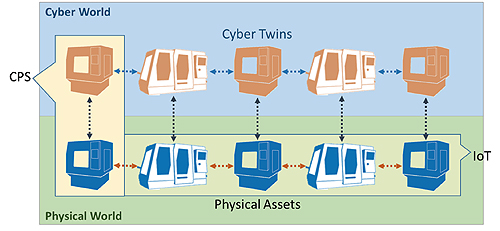
A cyber-physical system is characterized by a physical asset, such as a machine, and its digital twin; basically a software model that mimics the behavior of the physical asset. In contrast, the IoT in common parlance is generally limited to the physical assets, not their digital models.
Clearly there are challenges in handling the data generated by the IoT. In recent years, terms and definitions have emerged to help label and organize deficiencies and provide a road-map for future developments. Among those terms, cyber-physical system (CPS) has gotten a lot of attention.
The term cyber-physical system usually refers to systems of collaborating computational elements that control physical entities, generally using feedback from sensors they monitor. The similarities of using networking, internet and sensors in definitions of IoT and CPS might lead one to wonder if these two terms are different definitions of the same concept. But though there are similarities, a CPS is not the same thing as IoT.
The IoT is based on connections between physical assets through which data can transfer. The connections are made possible by the secure implementation of computer networks, internet and communication protocols. This communication is based on normal internet protocols or dedicated protocols such as MTConnect.
But despite the connectivity, the IoT paradigm doesn’t include the idea of information systems or analytics. On the other hand, CPSs are based on connectivity but run complex analytics. Complex inference in a CPS takes place through a centralized analytical hub where knowledge is excavated from raw data. Based on the knowledge inferred from the data, control commands get sent to the physical asset. All in all, it’s possible to view the IoT as the infrastructure that makes CPSs possible.
CPSs in manufacturing
The impact of IoT and CPS on industry will be significant. Today most industrial installations that use IoT and CPS concepts don’t do much more than embed sensors in manufacturing equipment or tag products with RFID tags. The data coming from these devices undergo comparatively little analysis. This is only the beginning step. The real value in these systems comes from using an information system to analyze the IoT data, then using the information that results to make informed decisions.
For example, data from embedded sensors in manufacturing equipment can be used to predict equipment wear or diagnose possible faults. It has been shown that these analytics can help reduce maintenance costs by nearly 40%. Performing such analysis on the data provided by IoT is the task of CPSs that improve the performance of manufacturing companies.
Data scientists have defined a five-level architecture for the tasks involved in CPSs that work in manufacturing. The visualization of the architecture is pyramid-shaped to represent the way data passing to higher levels gets reduced in size while the value of the information rises. The levels break out this way:
1. Connection: In the connection level, the data generated by connected machines, tools and products is gathered so it can be pushed up through the next levels.
2. Conversion: This level converts data to information using algorithms that are based on the application. For example, consider raw vibration data from a machine tool in a production line. The raw data carries no knowledge about the health or status of the machine. But health assessment algorithms can extract pertinent features and use them to get knowledge about the status of the machine.
3. Cyber: The cyber level receives processed information from the level below and uses it to create additional value. This level acts as the hub for information and performs complex analytics. For example, the cyber level might run sophisticated fleet-based analytical methods. These compare similar assets in a fleet or group (such as specific kinds of manufacturing machines in a single facility). It might run deep-learning algorithms to identify patterns in a large set of fleet data. Recommender systems, special algorithms that seek to predict the “rating” or “preference” for an item, might recommend the best way to use each individual asset.
It might seem as though the cyber and conversion levels do similar tasks. The major difference between the two is the scope of input information and the target of the algorithms. The conversion level is more focused on individual assets while the cyber level uses data from the entire system to infer additional knowledge. It is possible to perform conversion level analytics locally, at individual sensor nodes, say. But cyber-level methods take place on a central computation hub such as the cloud.
4. Cognition: The cognition level may be able to convert machine signals to health information and compare this information with other instances of it. In cognition level, the machine itself should take advantage of online monitoring to diagnose its own potential failures and become aware of its potential degradation in advance of any obvious signs of trouble. Based on adaptive learning from historical health evaluations, the system then can use specific prediction algorithms to foresee a potential failure and estimate the time to reach certain kinds of failures.
5. Configuration: A machine able to track its own health can detect failures early on and send health monitoring information to the operation level. This maintenance information can serve as feedback to business management systems. Operators and factory managers, in turn, can use it to make informed decisions. At the same time, the machine itself can adjust its working load or manufacturing schedule to reduce down time caused by machine malfunctions. The overall goal of these measures is to produce a system that is resilient—able to defend itself from difficulties by changing its own behaviors and preventing cascading failures that would otherwise disrupt operations.
Applying the 5C structure
The 5C structure can apply to different levels of an industrial concern including components, machines, fleets and the enterprise. Each level uses different analytics to generate useful information from raw data and generate useful knowledge about the system. The overall approach is that upper levels of the hierarchy use analytical methods to aggregate data from lower levels while passing important high-level information back down hierarchy.
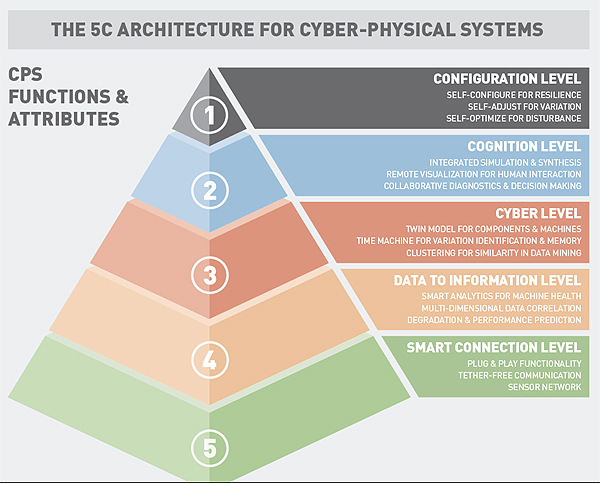
Data scientists have conceived a five-layer architecture to depict the way a cyber-physical system is implemented in industrial settings. The sense of the pyramid shape is that lower levels collect data that is analyzed and condensed at each upper level. So information fed to each higher level is more valuable than information coming into the level below.
Component level: This is the most detailed level of the 5C architecture. There is a virtual twin of the machine that exists in cyber space at this level. The virtual twins model the critical components of each machine. These twins (avatars) work in parallel with the physical component but with a huge difference: They are not bounded by time and location.
The avatars capture significant changes in the health status of each component. Once the physical component starts to degrade, the avatars start capturing the lifespan of the next component. Additionally, these virtual twins exist on the cloud. So they can interact with other component twins that are geographically far away. Such models log the lifespan of components undergoing various stress levels and which function in different working regimes. This is one of the mechanisms through which the system will gain self-awareness.
Machine Level: This level incorporates knowledge generated in the component level combined with machine operation history, system settings and so forth, to create an avatar for each machine. Virtual twins of similar machines are compared to each other as a way of identifying low-performance machines regardless of working regime.
Fleet Level: The fact that virtual models are not bounded by time and location brings an opportunity to implement methods for modifying the production flow in response to changing conditions. For example, it is possible to optimize the way machines in the fleet handle production work through use of historical machine performance data and component status from component and machine levels. This method can be used to maximize the life span of all components while simultaneously keeping production and quality levels at their best points. The overall result is a system that is self-maintaining and self-configuring.
Enterprise Level: The highest level aggregates the outcomes of previous levels to produce a high-level performance report. This level can also incorporate optimization methods based on the needs of the enterprise. For example, certain enterprises might find it feasible to modify the production rate at one or more plants based on the fleet performance while keeping the total production rate and costs the same.
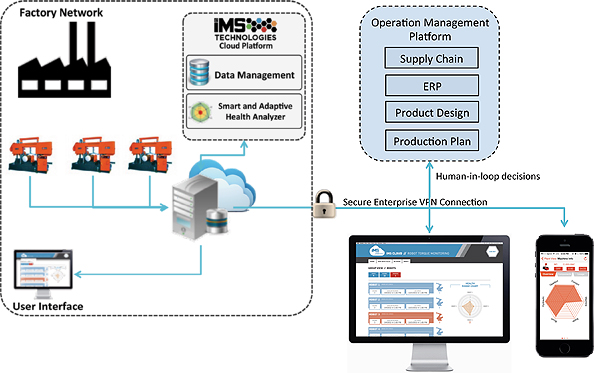
Operators and managers will interact with CPSs through a variety of interfaces made possible by the fact that analytical data gets stored in the cloud in standard formats.
CPSs store and maintain data in the cloud using standard formats. Use of standard formats lets developers create interactive web and mobile applications to present information to the users at different levels of the company. For example, a business executive needs information about throughput, production rate, supply chain management and so forth. He or she might need to see it on a smartphone during an international flight. In contrast, an engineer needs to see life-cycle management information and production quality estimates through a web interface inside the company.
In one case, band-saw machines instrumented with sensors served as a demonstration of a CPS. The band-saw units were in different geographical locations. Sensors measured vibration, acoustics and pressure. The CPS also collected controller signals about factors such as feed rate and size of the material. On-site industrial computers performed preliminary data-to-information conversion. In the cloud, more complex adaptive use-based health analysis methods assessed machine performance and predicted wear in different machine components. Analysis results were available through web and mobile applications.
These results are interesting, but they also reveal that many technologies—such as data storage systems, big data analysis methods, communication protocols and cyber-security—still need a lot of research, testing and development before the industrial IoT and CPSs can reach their potential.
References
NSF I/UCRC for Intelligent Maintenance Systems (IMS), University of Cincinnati
imscenter.net
IDC, EMC, The Digital Universe of Opportunities: Rich Data and Increasing Value of the Internet of Things, 2014
emc.com/collateral/analyst-reports/idc-digital-universe-2014.pdf
Vijayaraghavan A, Sobel W, Fox A, Dornfeld D, Warndorf P., Improving machine tool interoperability using standardized interface protocols: MT connect, Lab Manuf Sustain, 2008.
Chen G., Internet of Things towards Ubiquitous and Mobile Computing, Microsoft, 2010
research.microsoft.com/en-us/um/redmond/events/asiafacsum2010/presentations/guihai-chen_oct19.pdf
Bughin J, Chui M, Manyika J., An executive’s guide to the Internet of Things, McKinsey&Company, 2015
mckinsey.com/Insights/Business_Technology/An_executives_guide_to_the_Internet_of_Things?cid=digital-eml-alt-mip-mck-oth-1508
Lee J, Bagheri B, Kao H-A., A Cyber Physical Systems Architecture for Industry 4.0-based Manufacturing System, Manuf Lett 2015;3:18–23. doi:10.1016/j.mfglet.2014.12.001.
Yang S, Bagheri B, Kao H-A, Lee J., A Unified Framework and Platform for Designing of Cloud-Based Machine Health Monitoring and Manufacturing Systems, J Manuf Sci Eng 2015;137:040914. doi:10.1115/1.4030669.
Filed Under: CONNECTIVITY • fieldbuses • networks, SENSORS


Tell Us What You Think!