Failure models and estimates of useful product life have grown increasingly more accurate thanks to a better understanding of how devices and materials degrade under stress.
Leland Teschler • Executive Editor
Back in the early 1970s, a college classmate of mine told an interesting story about his summer job running production-line tests for a manufacturer of military communication gear. Initially the equipment he tested wouldn’t work at temperature extremes, so it went back for a quick redesign. Eventually my classmate started getting units that met spec when tested at high and low temperatures.
But the temperature fiasco put the company way behind in delivering units. So there was only time to check operation at a few data points.
In the waning days of summer, shipments finally caught up, and the pace slowed enough to make possible a more thorough test regime. It was at that point that my classmate made a discovery: Many of the units he checked would work fine at temperature extremes but went out of spec at temperatures in between. And, of course, his employer had been unknowingly shipping units that behaved this way for months.
Today we might say the this incident had a variety of causes, but prominent among them would be a lack of appreciation for what’s now called the Physics of Failure (also known as the Reliability Physics). PoF focuses on understanding the physical processes and mechanisms that cause degradation and failure of materials and components. It has long been used in the analysis of loads and stresses in civil and mechanical engineering from the point of view of strength and mechanics of materials.
Unfortunately it was rare to find PoF used during the early development of the electronics industry in the 1960s. One reason was that electrical engineers generally weren’t trained in structural analysis techniques. Another reason was cultural: Mechanical engineers just didn’t have as much clout as EEs in the electronics companies of the era.
Moreover, as with any new technology, the reasons for some kinds of circuit failures were not initially well understood. And often failures couldn’t be discerned by inspection. Unlike many mechanical and structural problems, most electronics failures are not obvious; it may take something along the lines of a scanning electron microscope to ferret out the difficulties. Consequently, EE failure analysis for many years depended on empirical rules of thumb and probabilistic reliability methods.
But a great deal of progress has been made in PoF modeling and the characterization of EE material properties. These advances are now used to make reliability tests more reflective of the actual stresses encountered during product use. And it is increasingly possible to run computerized durability simulations before products reach the hardware stage.
PoF basics
PoF has evolved to the point where methods are organized around three generic root-cause failure categories: errors and excessive variation, wear-out mechanisms, and over-stress mechanisms. As you might suspect, over stress failures arise when the stresses of the application rapidly or greatly exceed the strength or capabilities of a device’s materials. In mechanical products, over stress is basically a structural load issue. But over stress in EE products more generally includes overvoltage and over-current conditions. In well-designed EE products, over-stress failures are rare. They happen only when conditions are beyond the design intent of the device.
Frequent over-stress failures in EE products generally imply either the device was ill suited for the application or the designers underestimated the range of application stresses. PoF load-stress analysis serves to determine the strength limits of a design for stresses like shock and electrical transients and to assess whether the preventive measures are adequate.
Wear out in PoF is defined as stress-driven damage accumulation in materials. It covers failure mechanisms like fatigue and corrosion. Of course, mechanical engineers have developed numerous methods for structural stress analysis. These same techniques work on the microstructures of electronic components once their material properties have been characterized.
Wear out analysis does more than just estimate the mean time for parts to wear out. It also identifies the components or features most likely to wear out and the order in which they are likely to fail. It additionally estimates the time to first failure and the associated ensuing fall-out rates for various wear out mechanisms.
It’s often said that the most diverse and challenging category of PoF is that of infant mortality. The problem is that diverse, random, time-varying events are involved. So a cause-and-effect approach may work well to isolate specific failure modes but often doesn’t provide much insight generally. Thus the usual way of modeling these types of failures is mainly statistical.
Finesse
The basic aspects of PoF are straightforward, but it turns out there can be some finesse involved in devising a test plan able to expose failure mechanisms. In a nutshell, testing must be stressful enough to find problems but also correlate to the environment the product is likely to encounter during its use.
The approach often taken is to start with standard industry specifications and then modify or exceed them depending on circumstances.
Third-party testing firms say it is particularly important to use industry standard tests only as starting points for discerning failures in specific components. A frequently cited example is that of JEDEC (Joint Electron Device Engineering Council, now known as the Joint Solid State Technology Association) standards in the semiconductor industry. JEDEC standards typically outline accelerated stress test methods for estimating failure rates and confidence limits. The problem, say testing firms, is that the data JEDEC procedures provide can be quite limited: Stress testing typically takes place over relatively short time frames, so it can miss wear out behavior that isn’t caused by the extremes used in the stress test. Additionally, JEDEC stress tests typically look for failure mechanisms that are activated by heat—but not all of them are. The result can be an overestimation of the failures-in-time (FIT) rate, the number of failures that can be expected in one billion device-hours of operation.
In real life, failures can be caused by a combination of conditions. Materials can see both gradual and rapid degradation because of various stress conditions such as heat, chemicals, moisture, vibration, shock, and electrical loads. With these factors in mind, test labs suggest creating PoF test regimes that address two metrics, the desired lifetime and how well the product should perform in terms of factors such as survivability over its lifetime and during its warranty period.
A lot of PoF testing aims at duplicating conditions during shipping. Perhaps the simplest way of addressing shipping conditions is to make sure products can pass environmental tests spelled out in industry or military standards. Tests outlined in standards work well when all product environments are about the same. And standards might be the only source for test conditions when there’s no way to measure actual conditions that products see during their use.
But there are problems with depending on standards for PoF tests. Many such standards are at least 20 years old, so it’s fair to ask whether they reflect what products experience today. In addition, third-party test firms say manufacturers often are just guessing about the kinds of environmental conditions their products see before they wind up on customer delivery docks. So the environmental stresses detailed in standards could be far more or less harsh than those that products see in real life.
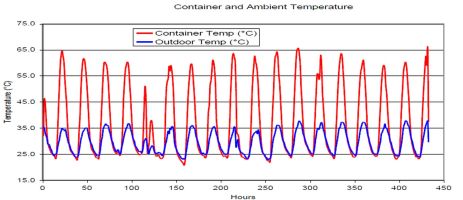
The importance of actually measuring environmental conditions rather than using educated guesses becomes evident in this graph compiled by DfR Solutions, now part of Ansys Inc. Measured data showed that the temperature inside a trucking container used to haul an electronic product could vary by about 40°C while the outside temperature varied by only 10°C. The data went into a PoF analysis associated with shipping environments.
The better approach is to base tests on actual measurements of similar products in similar environments. The idea is to determine the average and realistic worst-case conditions arising during manufacture, in the field, as well as during storage and transport.
Basing test regimes on actual measurements is particularly important if the product will see conditions during use that are unique. Electrical products headed to China, for example, must work even when electrical ground isn’t reliable. It is common to see electrical systems grounded to rebar there rather than to a conventional ground rod. Similarly, products going to India must be able to function despite brownouts which can happen several times daily. And the electrical system in Mexico is known for experiencing temporary surges in line voltage.
VQ modeling
It’s a lot easier to compensate for failure mechanisms when designs are still on paper and haven’t yet reached the hardware stage. That is the idea behind virtual qualification, VQ, which uses PoF-based degradation models to predict time of failure. VQ typically incorporates models such as those for interconnect fatigue in solder joints, capacitor failure, and integrated circuit wear out. The point of the VQ process is to determine if a proposed product can survive its anticipated life cycle. VQ (also called simulation-assisted reliability assessment) can be applied at the design stages and allows the design team to fold VQ concerns into decisions about suppliers and functional definitions of product features.
A VQ analysis assesses designs for reliability in the environments present in what’s called a life-cycle profile using a database of validated PoF models. The life-cycle profile basically contains models of environmental and operational stresses. The inputs are fed into a PoF model and simulation software that performs stress analysis, reliability assessment, and an analysis of sensitivity to stresses. The outputs of VQ are predictions of times-to-failure (TTFs) based on the most dominant failure mechanisms, stress margin conditions, and screening and accelerated testing conditions. VQ also evaluates the effects of different manufacturing processes on reliability as a function of typical manufacturing tolerances and defects. Finally, VQ can also help select test parameters for physical tests used to verify reliability.
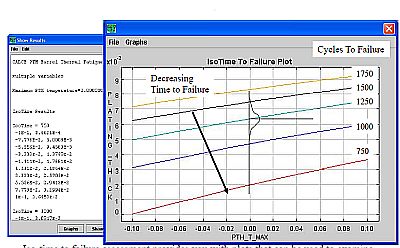
Output from the CALCE VQ software can include an iso-time to failure assessment. These take the form of plots used to examine the effect of changes in loading conditions versus design parameters. In this example, a reduction in plating thickness by 0.01 mm reduced expected life by 44%.
VQ combined with advanced optimization techniques can help examine trade-offs in design criteria for cost, electrical performance, thermal management, physical attributes, and reliability. Of course, the VQ process depends on accurate inputs for material properties, design configurations, dimensions, and operational and environmental conditions. In a nutshell, VQ is only as good as the accuracy of the failure mechanism models it uses.
Examples of commercially available VQ software include the CALCE (Center for Advanced Life Cycle Engineering at the University of Maryland) Simulation Assisted Reliability Assessment (SARA) software suite. The software provides design capture facilities to import design data as well as interfaces to define operational and environmental loads. The software works with what’s called the CALCE Design for Reliability (DfRTM) assessment process, which allows design engineers to interactively figure out what design changes do to product reliability.
CALCE software can be used to determine the life expectancy of electronic hardware under both anticipated life cycle loading and elevated stress tests. This information in turn can serve to help determine acceleration factors that make sense for elevated stress testing.
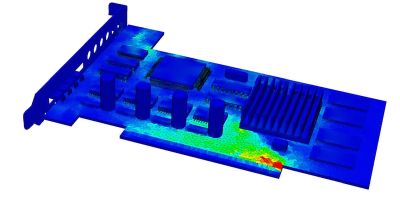
In one product reliability analysis using the Ansys Sherlock VQ program, the software generated a representative board that included all components and mounting conditions with their exact locations and material qualities. Sherlock modeled individual components including each solder ball on a BGA package to ensure that even small solder fatigue failures would be captured.
Another product in the VQ space is the Sherlock Automated Design Analysis software tool developed by DfR Solutions, now part of Ansys Inc. Designed specifically for PCBs, Sherlock predicts failure mechanism-specific failure rates over time using a combination of finite-element analysis and material properties to capture stress values and first-order analytical equations to evaluate damage evolution.
Sherlock’s physics-based prediction algorithms cover various kinds of stresses including elevated temperature, thermal cycling, vibrations (random and harmonic), mechanical shock and electrical stresses (voltage, current, power). To use Sherlock, users upload either a complete PCB design or individual data packets such as Gerber files, a bill of materials, or pick-and-pace files. Sherlock then performs several different types of reliability analysis and provides the constant failure rate and wear out (increasing failure rate) portions of the life curve for each combination of failure mechanism and component.
The software evaluates and predicts numerous specific failure mechanisms. Examples include low-cycle solder fatigue from thermal cycling, solder fatigue from vibration, solder cracking/component cracking/pad cratering from mechanical shock, electromigration, time-dependent dielectric breakdown, and several others.
Individual component and feature life curves are then summed to provide a physics-based reliability curve for the overall product. Sherlock also provides an overall reliability score. The reliability scoring, as well as individual scores and commentary for each area of analysis, is used when it’s not possible to make physics-based quantitative predictions. DW
You may also like:
Filed Under: MOTION CONTROL, MORE INDUSTRIES

