Design World

  • Home
  • Technologies
    • 3D CAD
    • Electronics • electrical
    • Fastening & Joining
    • Factory automation
    • Linear Motion
    • Motion Control
    • Test & Measurement
    • Sensors
    • Fluid power
  • Learn
    • Ebooks / Tech Tips
    • Engineering Week
    • Future of Design Engineering
    • MC² Motion Control Classrooms
    • Podcasts
    • Videos
    • Webinars
  • LEAP AWARDS
  • Leadership
    • 2022 Voting
    • 2021 Winners
  • Design Guide Library
  • Resources
    • 3D Cad Models
      • PARTsolutions
      • TraceParts
    • Digital Issues
      • Design World
      • EE World
    • Women in Engineering
  • Supplier Listings

Technology Shows 2015 Was Hottest in 200 Years

By Jake Meister | January 25, 2016

Share

In terms of surface temperature, 2015 was a scorcher. In fact, 2015 presented the warmest average surface temperature since the statistic was first consistently recorded in 1880, according to studies by NASA and NOAA scientists.

The average global surface temperature of 2015 obliterated the previous record holding year of 2014 by way of a 0.23 Fahrenheit increase. The significant rise was also the second hottest year-over-year increase in recorded history, with 1998 presented the most significant rise.

NASA conducted its research at its Goddard Institute for Space Studies (GISS) in New York (GISTEMP). The agency gathered the data using 6,300 weather stations, as well as ship- and buoy-based analysis of surface temperatures at sea and measurements taken from research facilities in Antarctica. Since the measurements are taken at various locations throughout the globe, and these same locations are sometimes influenced by effects such as urban heating, the data can be skewed. As a result, NASA uses an algorithm that takes all of these factors into account. Considering the differing locations and warming factors, NASA said that it is 94 percent confident that 2015 was the warmest year on record.

NOAA concluded that 2015 was the warmest year on record following its own independent study. According to NASA, the raw temperature data used by NOAA is for the most part the same as what the space agency uses. However, the two groups don’t share the same baseline period, or methods to gather information on polar regions and global temperatures.

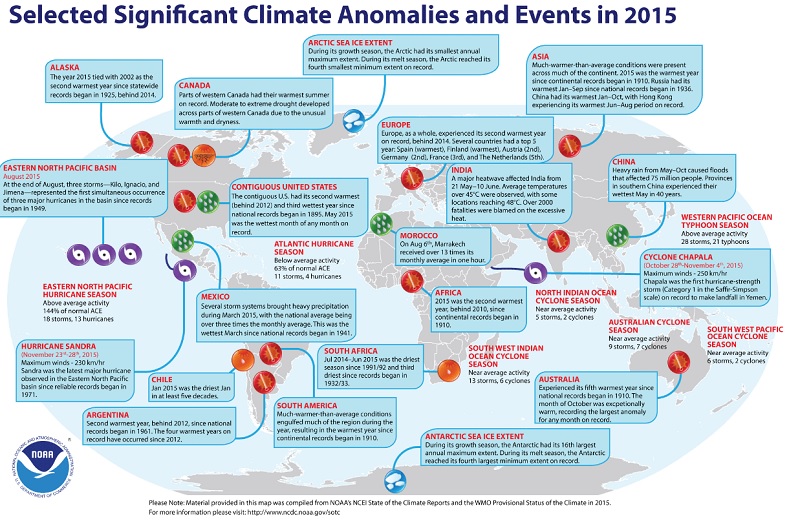
(Image: National Oceanic and Atmospheric Administration)

“Climate change is the challenge of our generation, and NASA’s vital work on this important issue affects every person on Earth,” said NASA Administrator Charles Bolden, according to a Wednesday statement by the agency. “Today’s announcement not only underscores how critical NASA’s Earth observation program is, it is a key data point that should make policy makers stand up and take notice – now is the time to act on climate.”

Since the recording of average global surface temperature began, the figure has risen by about 1.8 degrees. NASA believes this rise has mainly been caused by carbon dioxide and other emissions produced by human activity. El Niño can also cause changes in average global temperature. This is important to consider as a warming El Niño impacted the tropical Pacific Ocean for the majority of 2015. GISS Director Gavin Schmidt believes El Niño wasn’t a significant reason why 2015 was a record breaking year.

“2015 was remarkable even in the context of the ongoing El Niño,” he said. “Last year’s temperatures had an assist from El Niño, but it is the cumulative effect of the long-term trend that has resulted in the record warming that we are seeing.”

NASA has concluded that the majority of the warming has taken place in the last 35 years. Since 2001, Earth has experienced 15 of its 16 warmest years since the recording began.

Though temperatures have risen as a whole, not every region experienced record highs. NASA found the annual mean temperature for the 48 contiguous states in America was the second highest on record in 2015.

More information on NASA’s findings can be found here.


Filed Under: Test + measurement • test equipment


Related Articles Read More >

mti
Portable signal simulator works with jet engine vibration measurement/balancing systems
MTI
Portable engine balancing system for business and regional jets
moog
Test controller features compact footprint, 5 kHz loop rate
SAKOR Technologies’ new dynamometer line to meet international environmental standards

DESIGN GUIDE LIBRARY

“motion

Enews Sign Up

Motion Control Classroom

Design World Digital Edition

cover

Browse the most current issue of Design World and back issues in an easy to use high quality format. Clip, share and download with the leading design engineering magazine today.

EDABoard the Forum for Electronics

Top global problem solving EE forum covering Microcontrollers, DSP, Networking, Analog and Digital Design, RF, Power Electronics, PCB Routing and much more

EDABoard: Forum for electronics

Sponsored Content

  • Global supply needs drive increased manufacturing footprint development
  • How to Increase Rotational Capacity for a Retaining Ring
  • Cordis high resolution electronic proportional pressure controls
  • WAGO’s custom designed interface wiring system making industrial applications easier
  • 10 Reasons to Specify Valve Manifolds
  • Case study: How a 3D-printed tool saved thousands of hours and dollars

Design World Podcasts

May 17, 2022
Another view on additive and the aerospace industry
See More >
Engineering Exchange

The Engineering Exchange is a global educational networking community for engineers.

Connect, share, and learn today »

Design World
  • Advertising
  • About us
  • Contact
  • Manage your Design World Subscription
  • Subscribe
  • Design World Digital Network
  • Engineering White Papers
  • LEAP AWARDS

Copyright © 2022 WTWH Media LLC. All Rights Reserved. The material on this site may not be reproduced, distributed, transmitted, cached or otherwise used, except with the prior written permission of WTWH Media
Privacy Policy | Advertising | About Us

Search Design World

  • Home
  • Technologies
    • 3D CAD
    • Electronics • electrical
    • Fastening & Joining
    • Factory automation
    • Linear Motion
    • Motion Control
    • Test & Measurement
    • Sensors
    • Fluid power
  • Learn
    • Ebooks / Tech Tips
    • Engineering Week
    • Future of Design Engineering
    • MC² Motion Control Classrooms
    • Podcasts
    • Videos
    • Webinars
  • LEAP AWARDS
  • Leadership
    • 2022 Voting
    • 2021 Winners
  • Design Guide Library
  • Resources
    • 3D Cad Models
      • PARTsolutions
      • TraceParts
    • Digital Issues
      • Design World
      • EE World
    • Women in Engineering
  • Supplier Listings